
Update to MAPP Program – September 2014
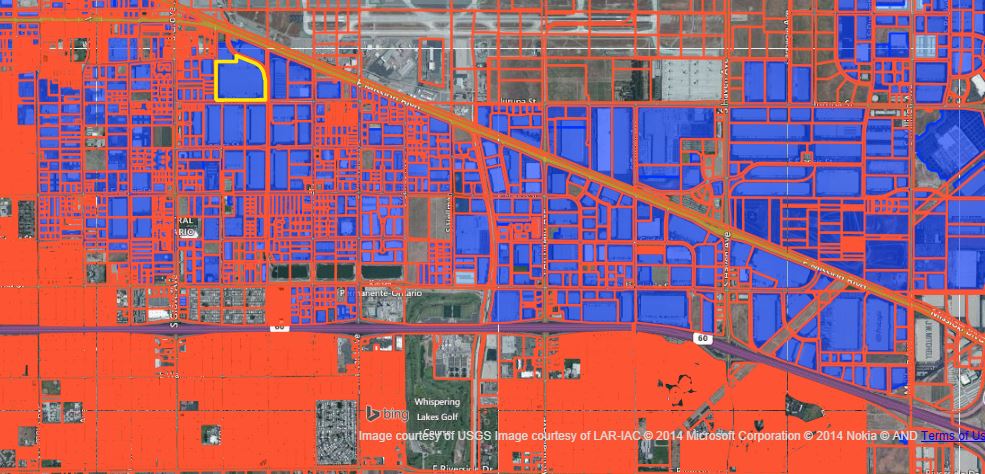
We’ve added a zoning layer to San Bernadino and Riverside Counties. The blue colored parcels is everything zoned industrial in the Inland Empire. It’s a great help when identifying industrial land and buildings.
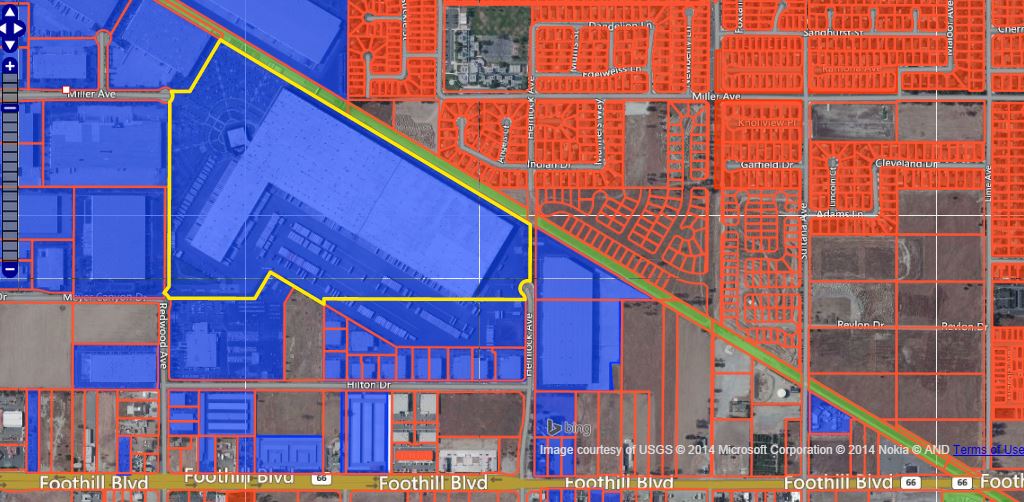
Another interesting feature is the rail lines are colored green so this also makes it easy to locate every large industrial parcel with rail service. This is a visual example but we can just as easily run a query from our database that provides the same information in tabular form for mailing and calling purposes. Pictured is the Dayton-Hudson warehouse in Fontana.
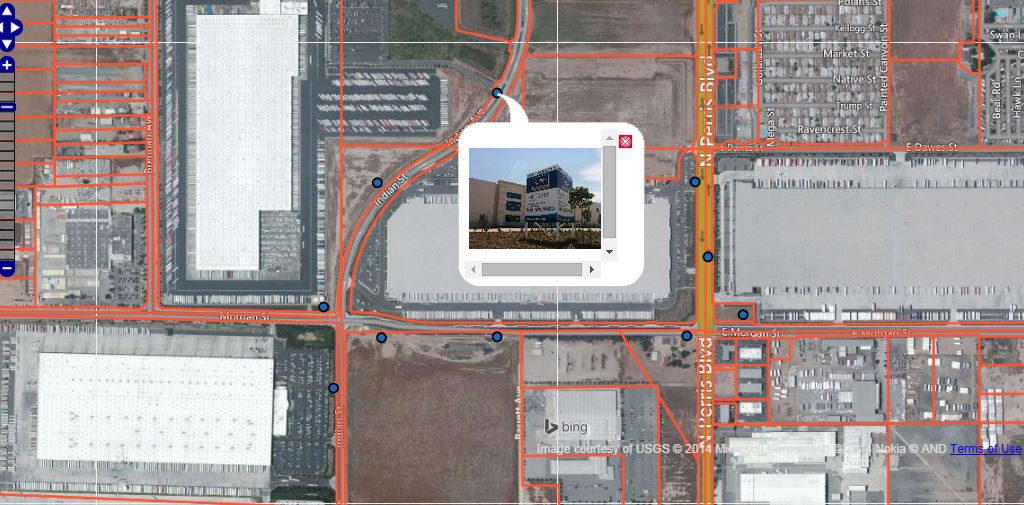
One new feature is geotagging. We can take pictures from our cell phone and it automatically places the location information on the MAPP view. After a day of looking at sites, the photos created serve as an excellent reference of what we saw and acts as a reminder of properties that require further investigation. Not only can we geotag when we are in the field, but we can also place collateral information (photos, flyers, site plans) from anywhere at the proper locations. For example, in Perris, CA, the blue markers show the geotagged locations with a thumbnail of a new building.
We’ve developed a GIS mapping program for Los Angeles commercial real estate. We call it MAPP for Map App. It’s available for exclusive clients. By combining different databases, aerials, parcels, zoning, and other important property attributes we give a complete spatial view of the Los Angeles County property market. The initial focus is on industrial and infill land sites. MAPP will ease the search for property and help fill empty buildings.
Because the program has been written in MYSQL we can operate it from any computer like any cloud-based platform. It’s great to use in the field. But the power comes from its ability to search and query. For example, if there is a vacant building of 50,000 square feet, we can know and show with confidence that we have contacted every possible tenant. For companies searching for specific properties, we can find every off-market site that meets the customers requirement. Currently we are identifying every rail-served building in Los Angeles County. For land developers, MAPP is particularly useful.
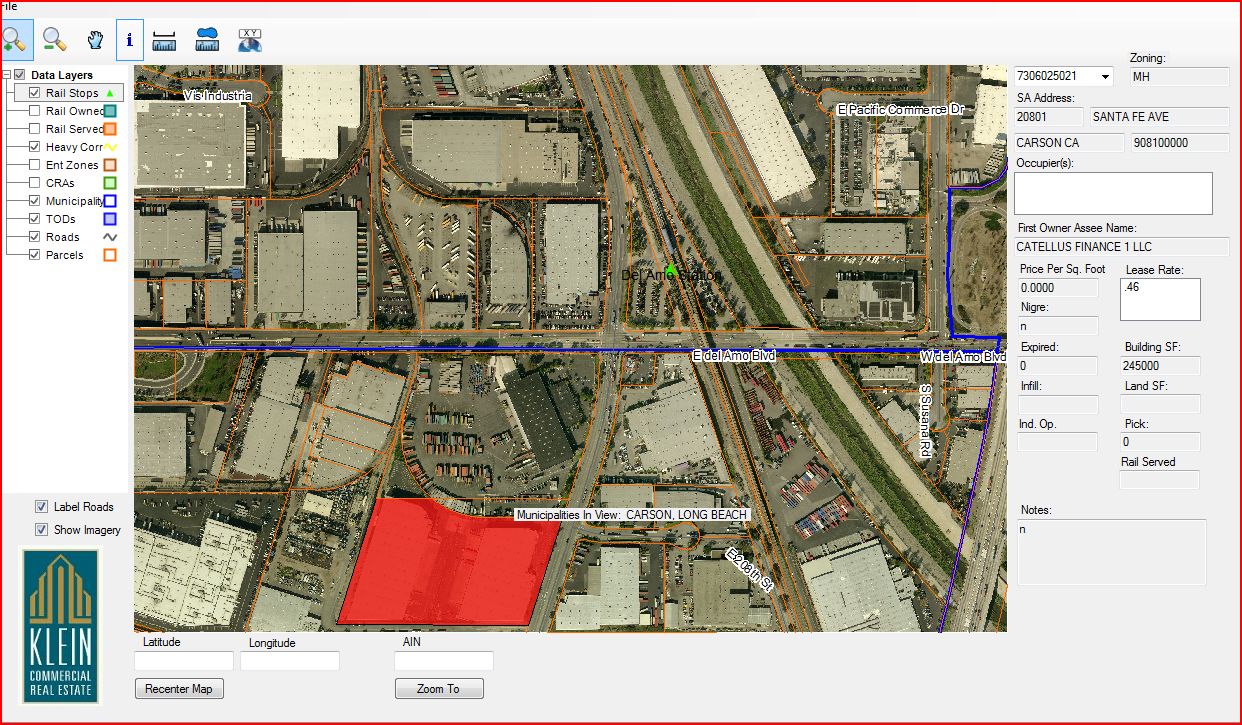
We update the program frequently with our programmers but the best feature is we are able to customize MAPP so it can have a have a specific client focus depending on the need. Below is a screen shot of the Carson area that shows real estate attributes and several special criteria we use for identification. On the left we have layers for zoning, redevelopment areas, city boundaries, rail service, and high density development areas. Running separately is the actual database that powers MAPP. It’s the power of the relational database that makes this program effective and versatile.
We are still learning what MAPP can do, but the important thing is what it can do for you.
The backend of the MAPP program is run by a MYSQL database that contains all owner information for Los Angeles County, tenants in the markets we work, and available property. When we mash up the data by AIN number, you get some interesting results. For instance, owners of every property, square footage of every tenant, location of every property in a TOD zone, or every building that is served by heavy rail. The database is easily searchable by different criteria to customize specific reports. MAPP or the database separately is a great tool to help owners and tenants. When you combine the two, it’s very easy to search for hard-to-find information. Plus the way the program is designed, we can easily write a new script to provide precise results. If combining SQL and GIS was not enough, we can port the entire program to Salesforce to give us the marketing extension.
[1].jpg)
We are already getting great results in our primary business of finding development sites. But the real power comes from taking your requirement and feeding in the criteria that is important to your business. MAPP is particularly revealing for companies that look for multiple sites because as you narrow your preferences, fewer, better results appear. MAPP is a deal finder’s tool.
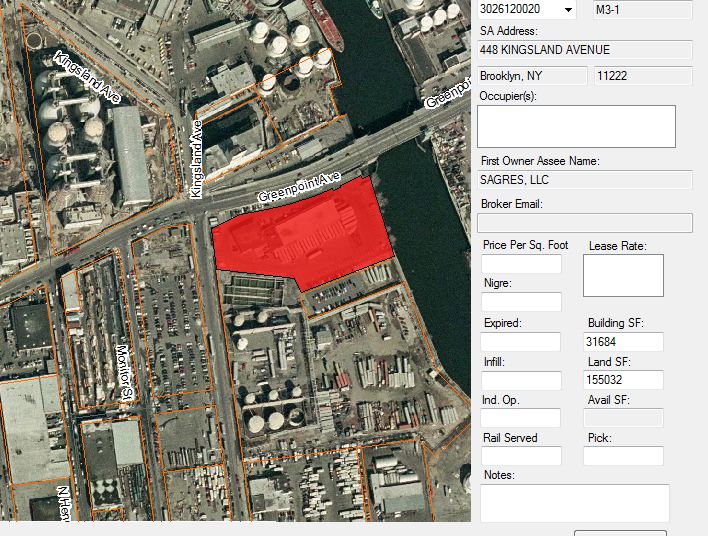
Because I spend time in New York, I wanted to see if the MAPP Program can be used in other cities. I was able to get the USGS Imagery for New York and New Jersey. The NYC Planning Department sold me the parcel data and shape files for the five Boroughs. This is a picture of Greenpoint Avenue and Newton Creek in Brooklyn. It covers an old industrial area and the selected parcel is highlighted with the ownership information and other property details. It would be a snap to obtain the tenant information. I think this proves that MAPP can be used in any municipality worldwide if the data is available.
Currently there are no plans to make MAPP a commercial product. It is an internal tool that we use for specific customer projects. We have found that customers prefer to see the final query results and they are not as interested in the program workings. We are happy to oblige in screen sharing sessions or in our office.
Recent Article about the MAPP Program appearing in SIOR Professional Report – Spring, 2013 Issue