All information has been obtained from reliable sources, however Property Owner and Broker make no representations as to the information’s accuracy. All tenants and buyers to independently investigate and verify all matters pertaining to the property including but not limited to zoning, physical details, environmental, improvements and any other conditions that affect the Tenant’s or Buyer’s use and occupancy of the property.
Leasing conditions throughout Los Angeles have moderated from the rent surges of the Covid period. Nowhere felt the impact from the Supply Chain Crisis more acutely than San Pedro Bay. There were severe space shortages and warehouse rents were increasing daily. The frenzy was magnified by extremely low interest rates that brought a host of investors to purchase sub-institutional grade property and land developments.
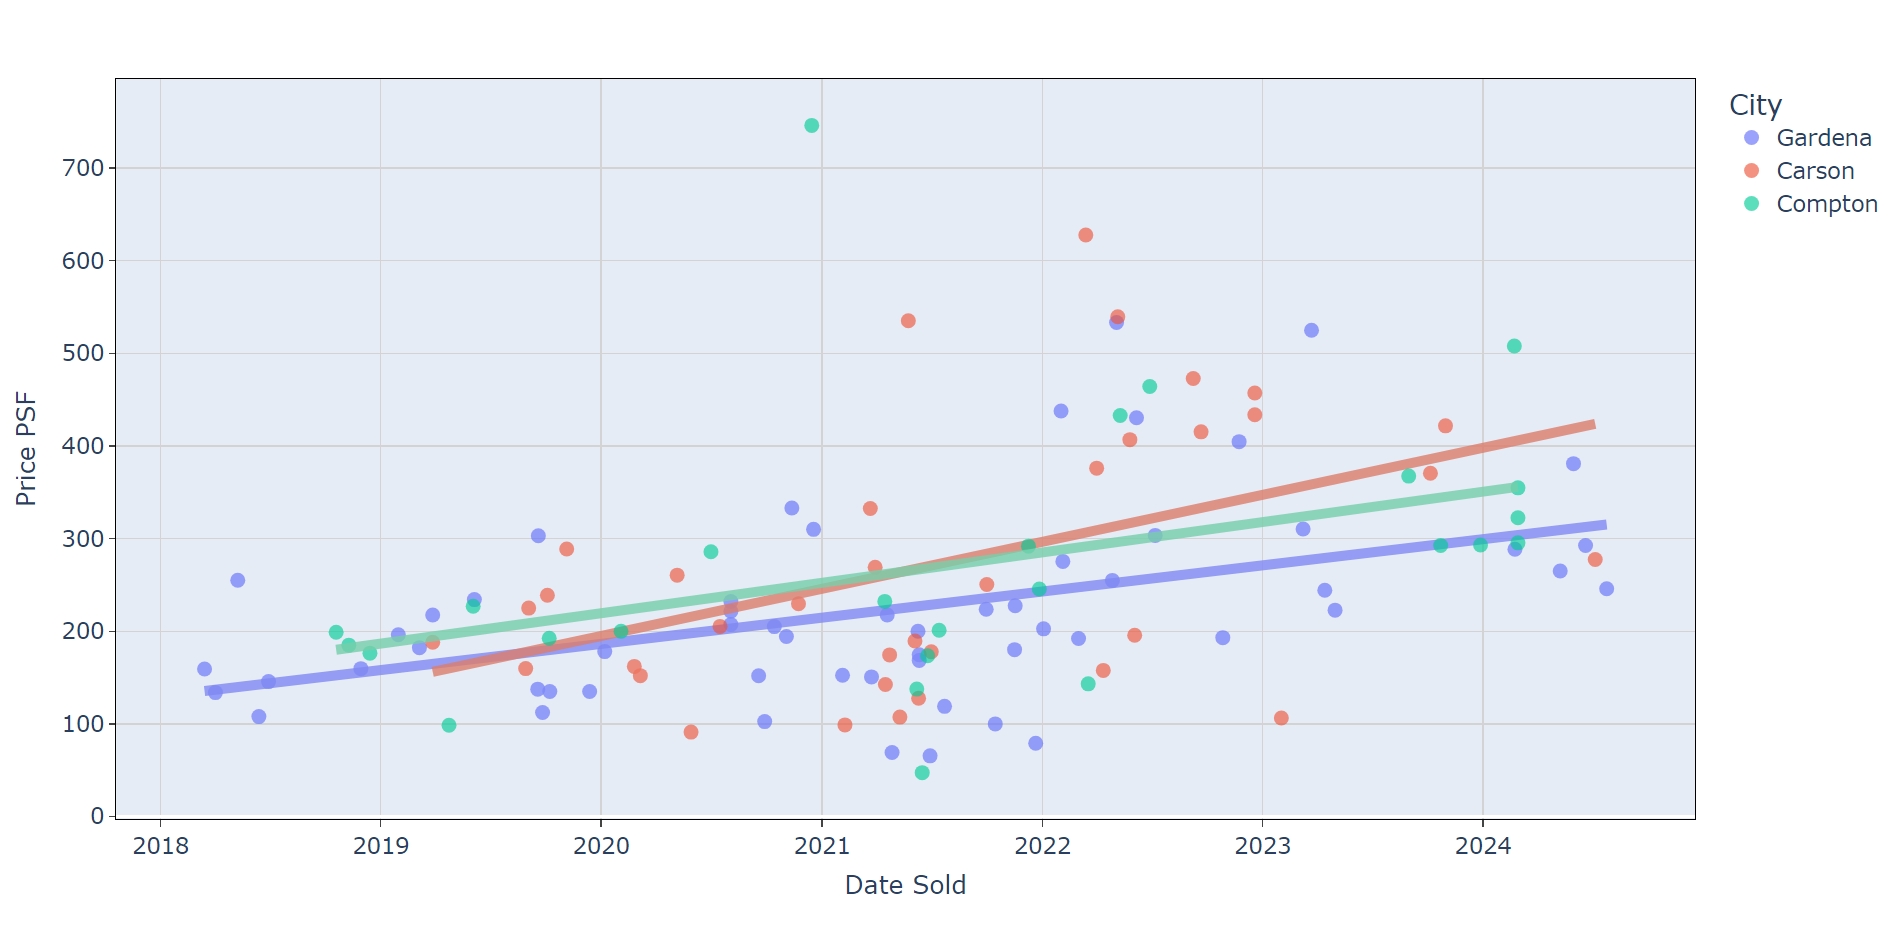
Industrial Rental Sales
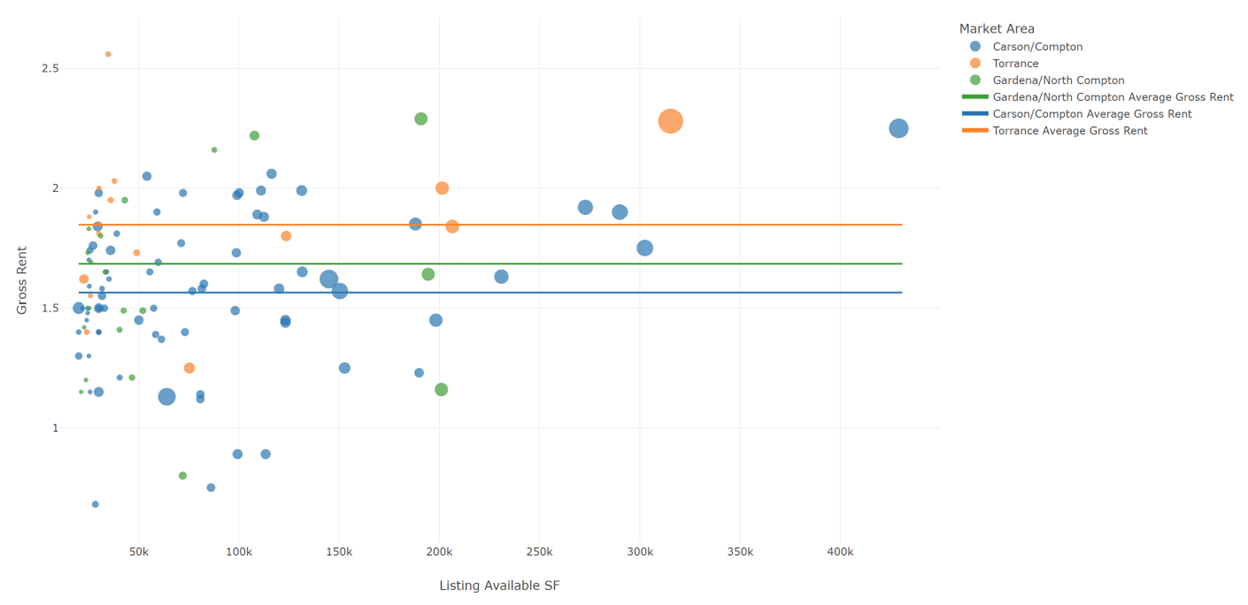
A mix of price moderation and higher interest rates rate starting in early 2023 brought a cooling to market conditions and we are now in a normally functioning market that favors the tenant. While rents are down from the peak, they are steady on a long-term basis. There is good supply in the South Bay area. You can find reasonable space at $1.50 per foot Gross (including taxes and property insurance). Newer buildings are priced in the range of $2.50 per foot (all-in).Property taxes, due to Prop 13, have an outsized effect on the rent.
Not only has the market normalized, meaning rents have come down, but development activity created a bifurcation between two tiers of space. One is the older tier, with lower rents, smaller footprints, partial obsolescence, and suitable for local tenants. The new tier is “development space” recently completed with superior attributes, large footprints, built for regional sized companies or national freight distributors. The pricing difference between the two tiers is 60%, coincidentally, the same difference between 32’ high and 20’ high. Development spaces, while located in Gardena, are not necessarily intended for organically growing Gardena companies but for larger companies comparing the entire L.A. Basin.
New Development
While current supply is plentiful, the rift between residents and industrial uses will result in a long-term restriction of industrial buildings. Local moratoriums, zoning prohibitions, and statewide measures like California Assembly Bill 98, (Planning and zoning: logistics use: truck routes), enshrines a 500’ and in other cases, a 900’ buffer from “sensitive receptors”. Inother words, intensive industrial need to be away from schools, residences, churches,medical facilities and other places with a high concentration of people.
While Green Zone ordinances in LA County are meant to satisfy residents, it doesn’t address the underlying issues of crime, unsanitary conditions, trash, and homelessness. If the County were to listen to businesses, they would attract better companies and property owners wouldn’t have to solely rely on truckers and warehousers to lease their properties. Green zones and similar restrictions are the result of neglect by County leaders desperate to appease residents without having to do the hard work of making these neighborhoods safe and livable.
*******************************************************************************************
The opportunity in Los Angeles industrial real estate is as great now as ever because activity is constant.
Los Angeles a premier industrial market in the United States. While interest rates, trade flows, taxes and governmental policies will alter your tactics, there are three consistent dynamics which keep deals flowing.
1. Real estate is local. This principle of the property business states the most interested buyers and tenants are closest to the property in ever widening circles. Social Scientists and Urban Geographers call it agglomeration and Los Angeles has a very high ratio of local commercial interaction. When businesses grow, they want to maintain proximity to markets, customers, and employees and will often decide to stay close.
Available Property
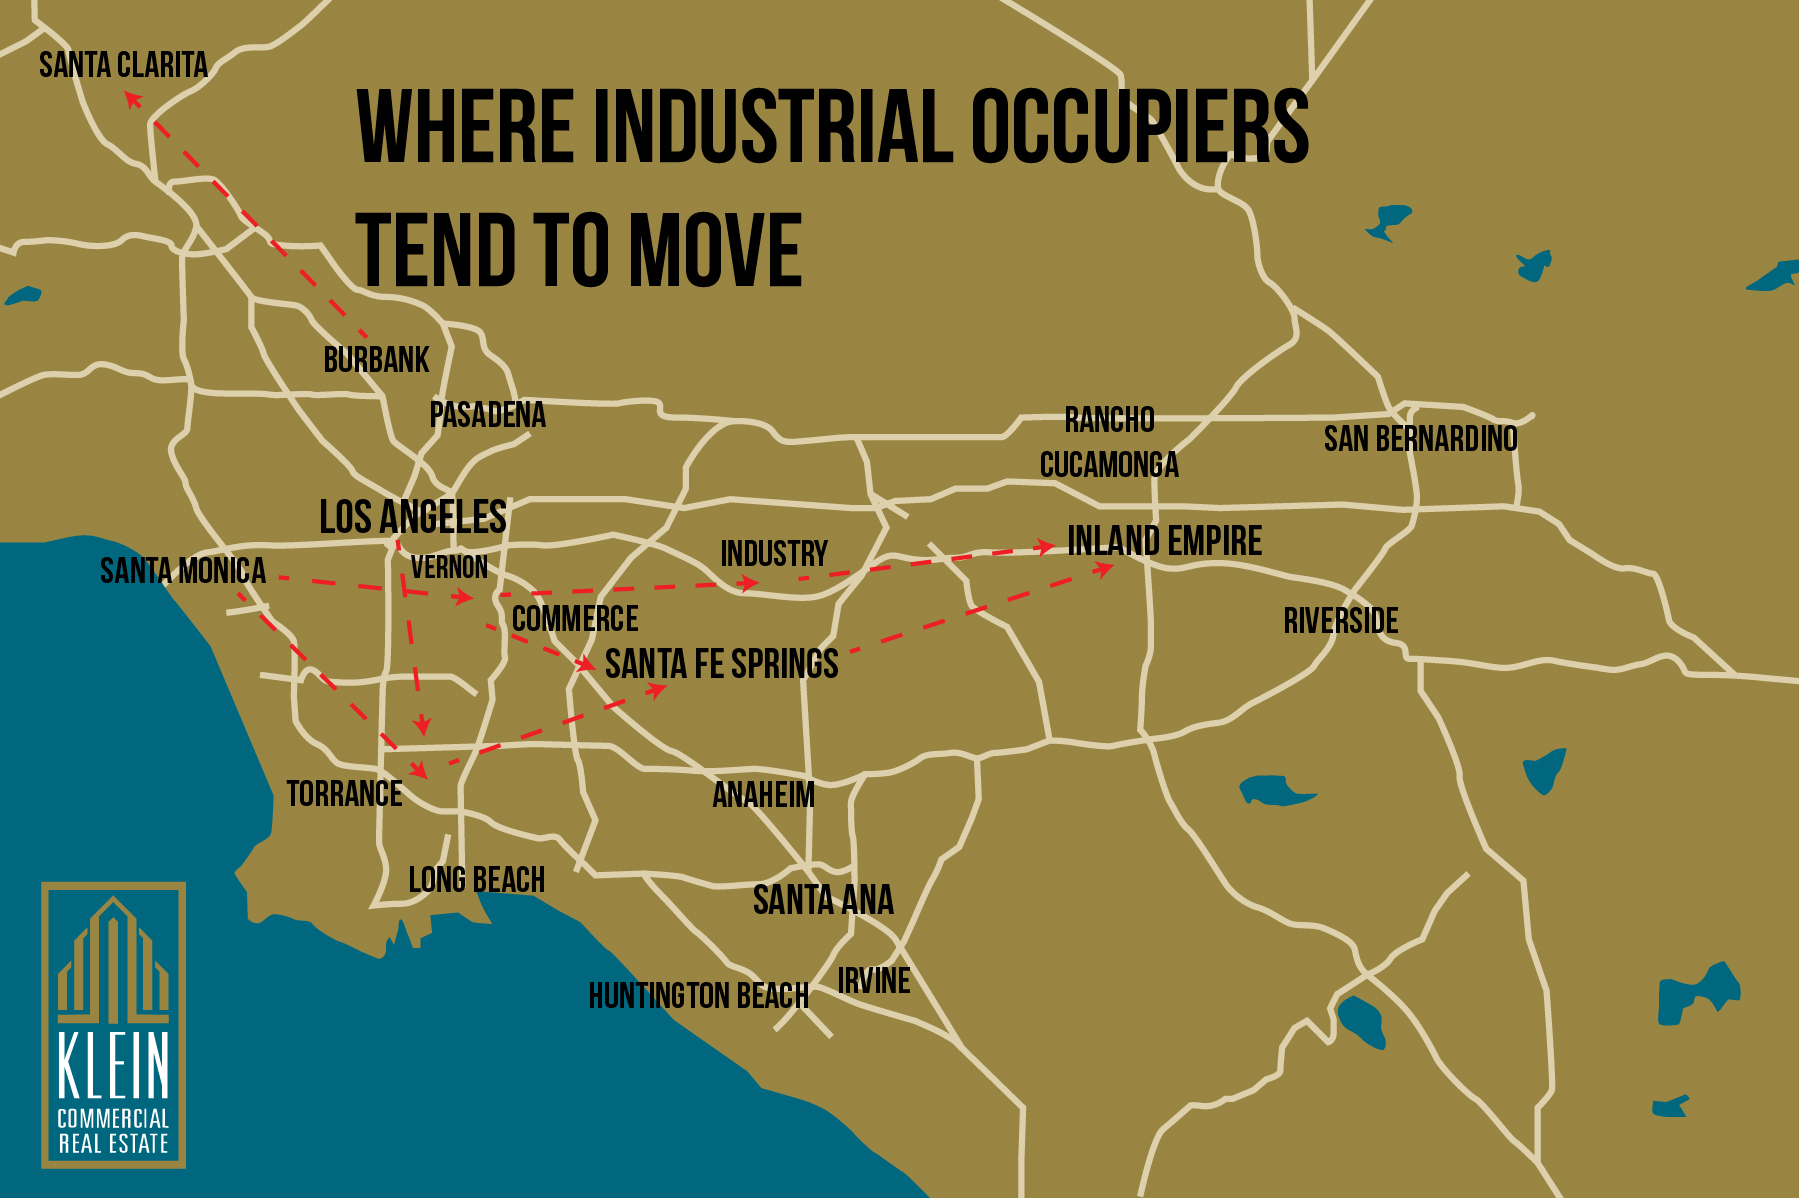
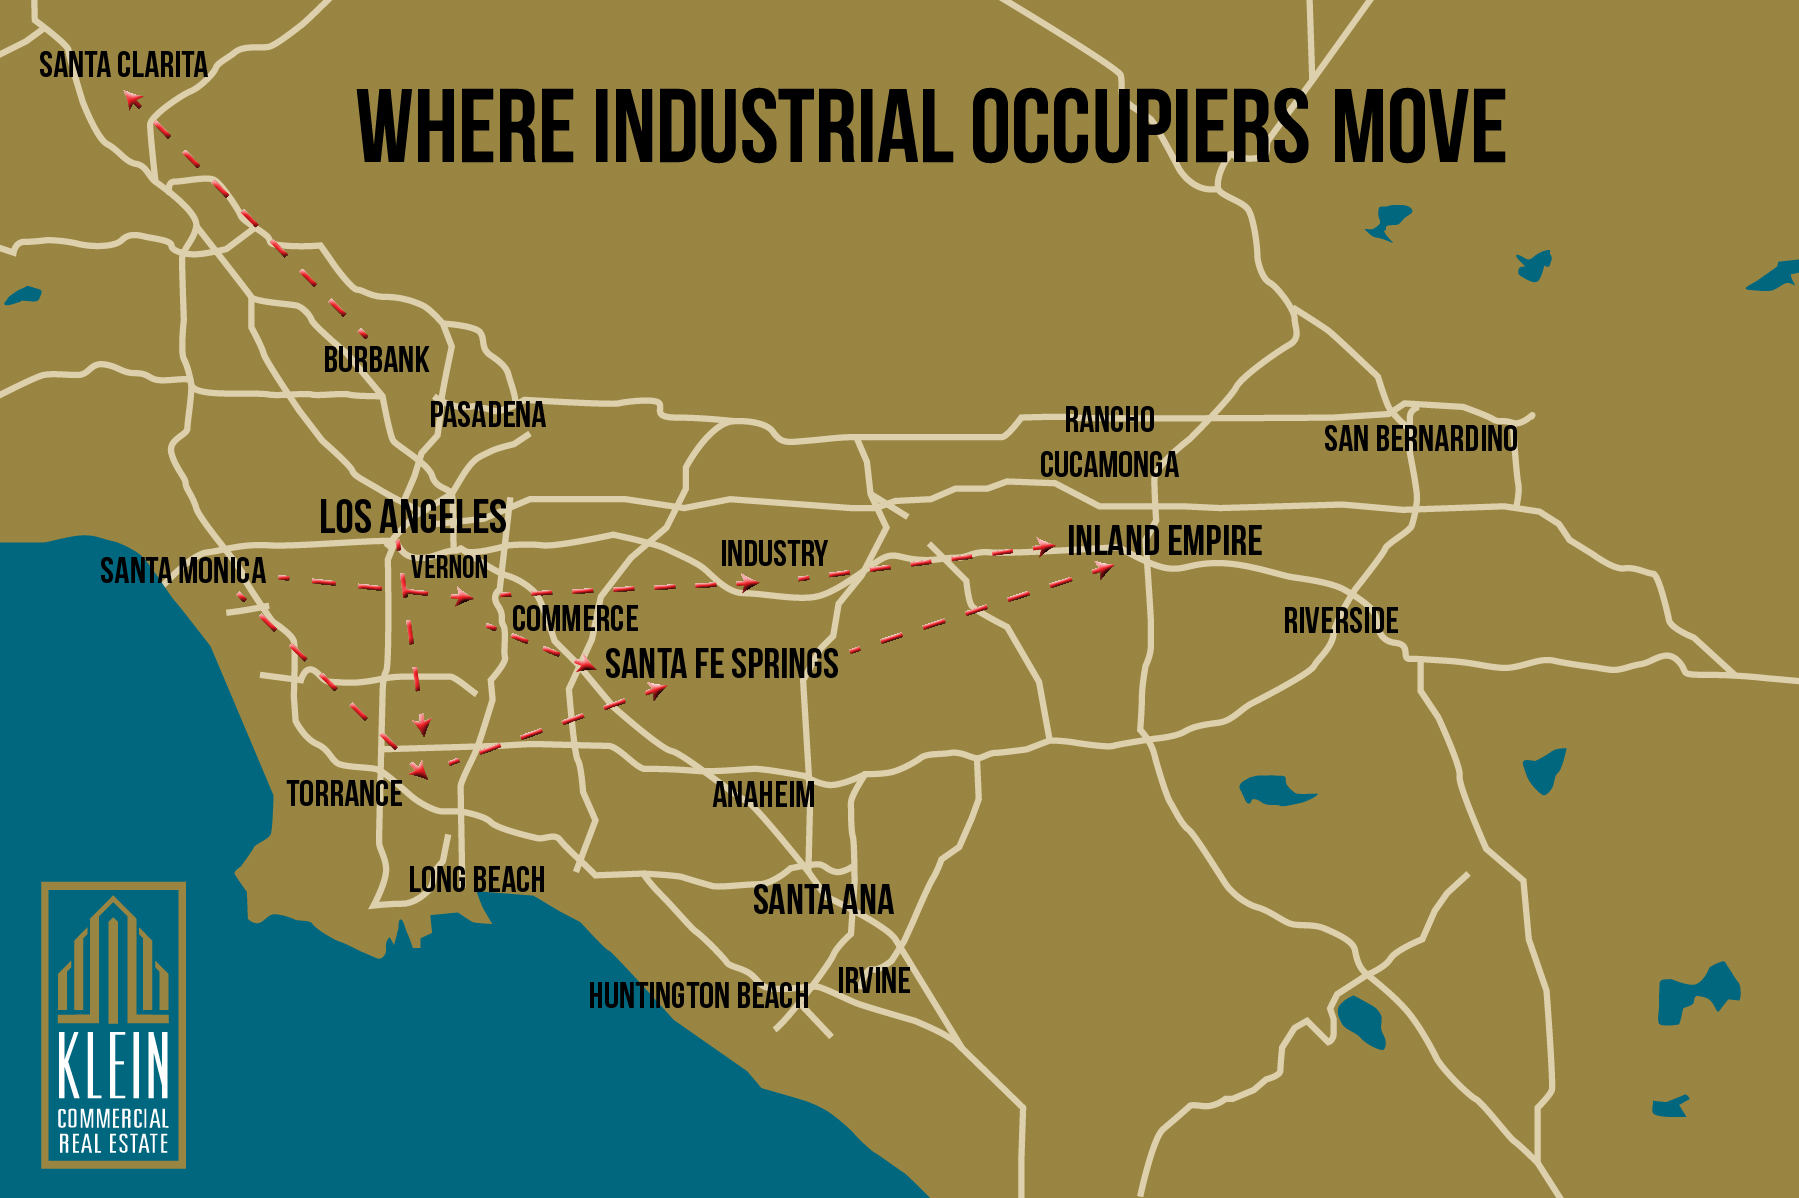
2. It’s possible to anticipate where companies are moving from based on historical trends. Companies generally move for more space, less rent and to improve their business.Companies in L. A. County generally follow the same movement patterns, mostly based on the freeway network. As an example, West L.A. companies will move south down the 405 Freeway. South Bay Companies will move to Mid Counties (91 Freeway). Mid Counties will move to the Inland Empire (10 , 60 and 91). There are many other patterns in Southern California that keeps company movement local and predictable. Anticipating where tenants come from keep buildings leased.
4. Aside from geography, there is always robust transactional activity among investors. Except in rare instances of turbulence, properties flow from private hands to investor control. It’s a steady force as new capital follows an old business plan of finding buildings that will provide a reasonable return to their investors. Los Angeles is a crossroads destination with a lot of property still residing in private hands. In addition, Owner/Users will buy when the mortgage payment is equivalent to rent. It’s a positive time to purchase.
****************************************************************************************************
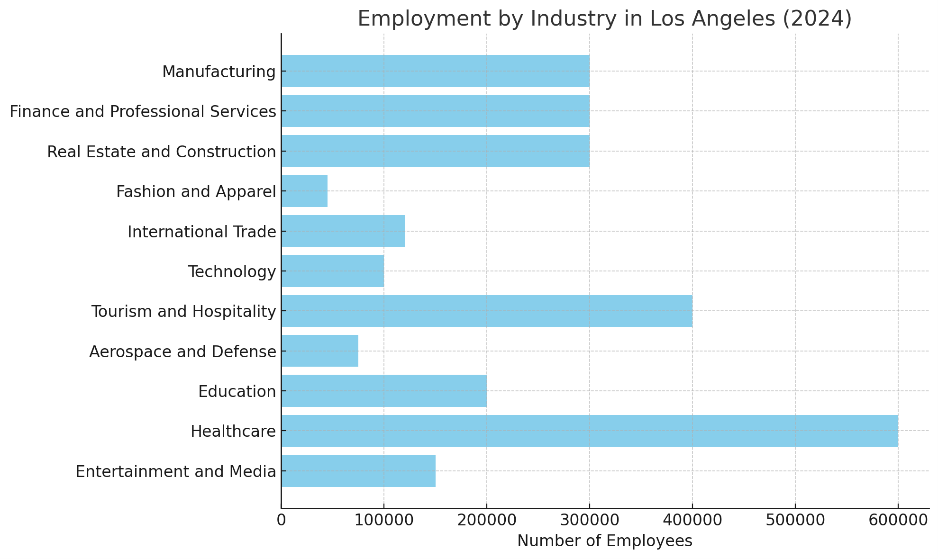
What makes Southern California an industrial powerhouse? Within a 60-minute drive of Downtown Los Angeles, there is approximately 2 Billion square feet of industrial space worth $500 Billion dollars and is almost 15% of the entire industrial space in the U.S.
Most people arrive at LAX which is the largest employment center of aerospace and defense employment in the U.S. SpaceX, TRW, Lockheed Martin, Northrop, BAE, and Raytheon have major facilities along with their suppliers and subcontractors. As a derivative of its engineering and technical resources , El Segundo has a burgeoning “Hard Tech” industry that combines digital technology and physical manufacturing.
Thirty minutes south on the 405 Freeway are the Ports of Long Beach and Los Angeles. Each by themselves has more container volume than any other US port and when combined creates a shipping colossus that supports local warehouses and trade from the South Bay, to Downtown, Mid Counties, Inland Empire and as far as Phoenix and Las Vegas. Approximately 4 million rail cars head to other parts of the U.S. from the six intermodal railyards in the region.
Heading north on the Long Beach Freeway (710), in thirty minutes, you reach Downtown Los Angeles, particularly Commerce and Vernon. These cities were the manufacturing center of the West with large production plants that built cars, tires, glass, food, plastics, furniture and clothing. While many of the largest plants are gone, it left a robust industrial infrastructure with approximately 4,000 companies and 100,000 employees. Today, food, apparel, furniture, metals, machinery and the second largest U.S. wholesale market are major businesses.
Another 20 minutes northeast on the 101 Freeway, you reach Hollywood, home to the international capital of film, television, recording, pre-and-post production employing 200,000 (down from 250,000 at its peak in 2017).
Heading east is the San Gabriel Valley and Inland Empire with 1 Billion square feet of industrial buildings. To the Southeast towards Orange County is Mid Counties. And north is the San Fernando Valley. Each of these submarkets have more industrial space by themselves than most U.S. metros.
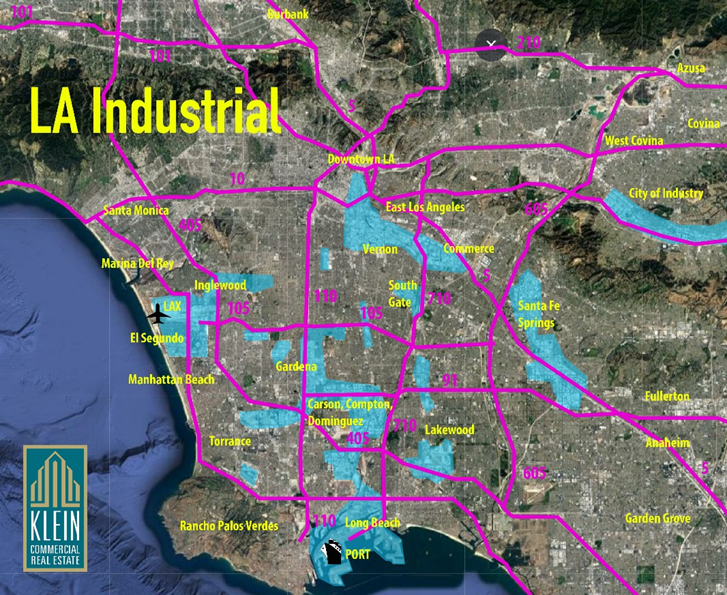
Industrial Zones
Klein Commercial Real Estate has been locally headquartered in Gardena for 45 years. Our specialty is selling industrial buildings and representing corporations in their real estate moves.
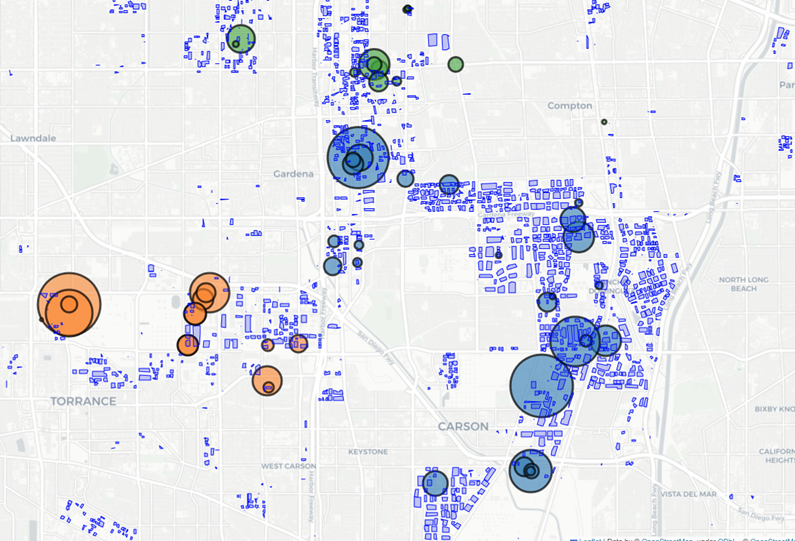
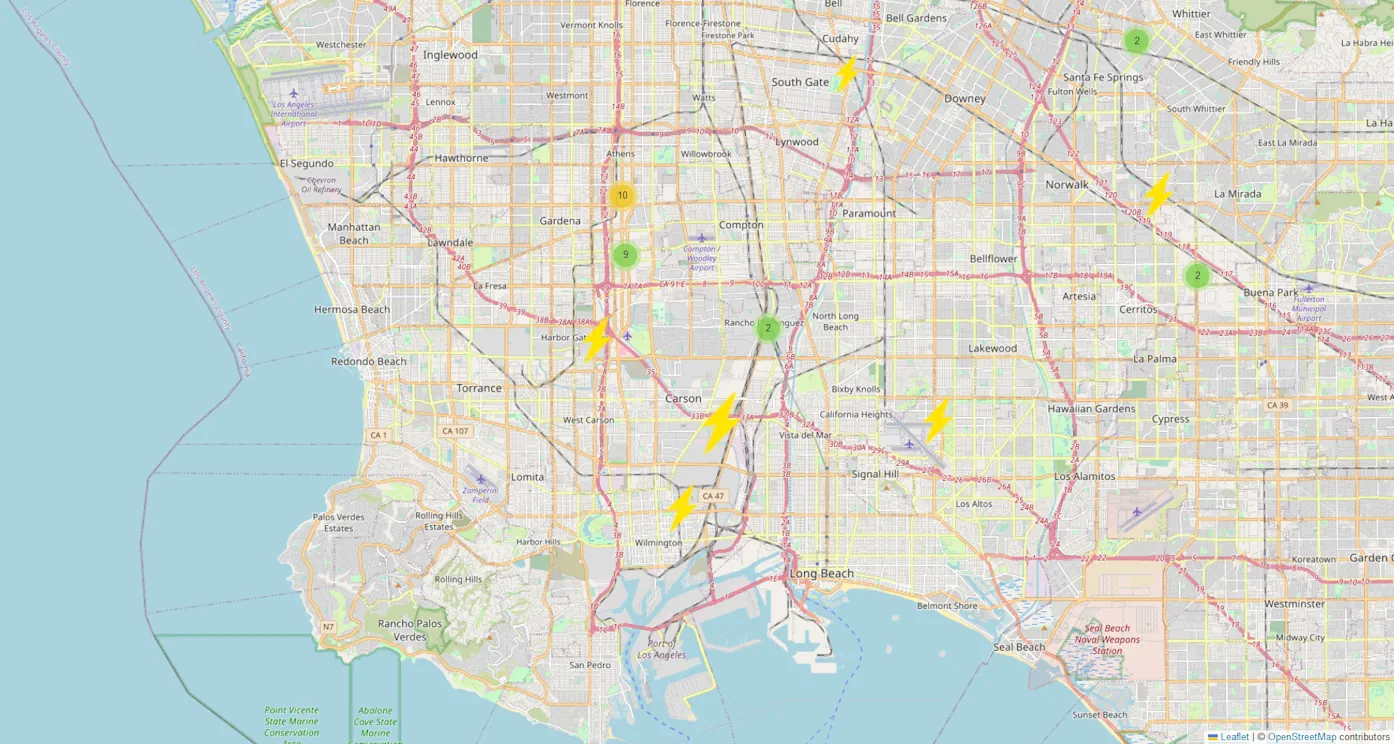
In less than 18 months, the industrial building market has shifted from low vacancy to abundancy. There are now 215 industrial spaces, greater than 50,000 square feet, available in the Greater Los Angeles Basin. This does not include Orange County, Inland Empire, or San Fernando Valley. Only the areas you see on the map (below). About 20% is sublease space.
The best value for most tenants is second and third generation spaces. Many of these buildings built since the year 2000 have the same characteristics as brand-new buildings except for ceiling heights, although many of these 2nd Gen buildings still go to 30’.
36’ high buildings came in around 2023
30’ – 32’ Clear was the norm starting in 2000
24’ Clear started as far back as 1975
Older buildings are equally functional as new buildings for less rent, especially if they have a low tax basis. One exception is if the tenant plans to install interior warehouse installations like mezzanines or specialty racking and automation. In these cases, latest generation buildings have an economic advantage because of height.
Some of the calculations we perform to determine functionality include:
Location and Distance
Docks per 10,000 SF
Building to land ratio
Cubic Capacity and Cost per Cube
Property Taxes/Expenses
Ceiling height
Sublease
To identify the better buildings, we subject all available properties through a macro analysis. This is the best way to identify differences in functionality and cost when there are a lot of choices.
Here is an example:
Let’s say you are in 100,000 square feet in the South Bay and you want to double in size. Some tenants will move completely to put everything under one roof. Other tenants will look for a satellite building as an interim step. Most South Bay companies will look locally and as far as Santa Fe Springs and Mid Counties. Some will want to go as far as IE West. What will you find?
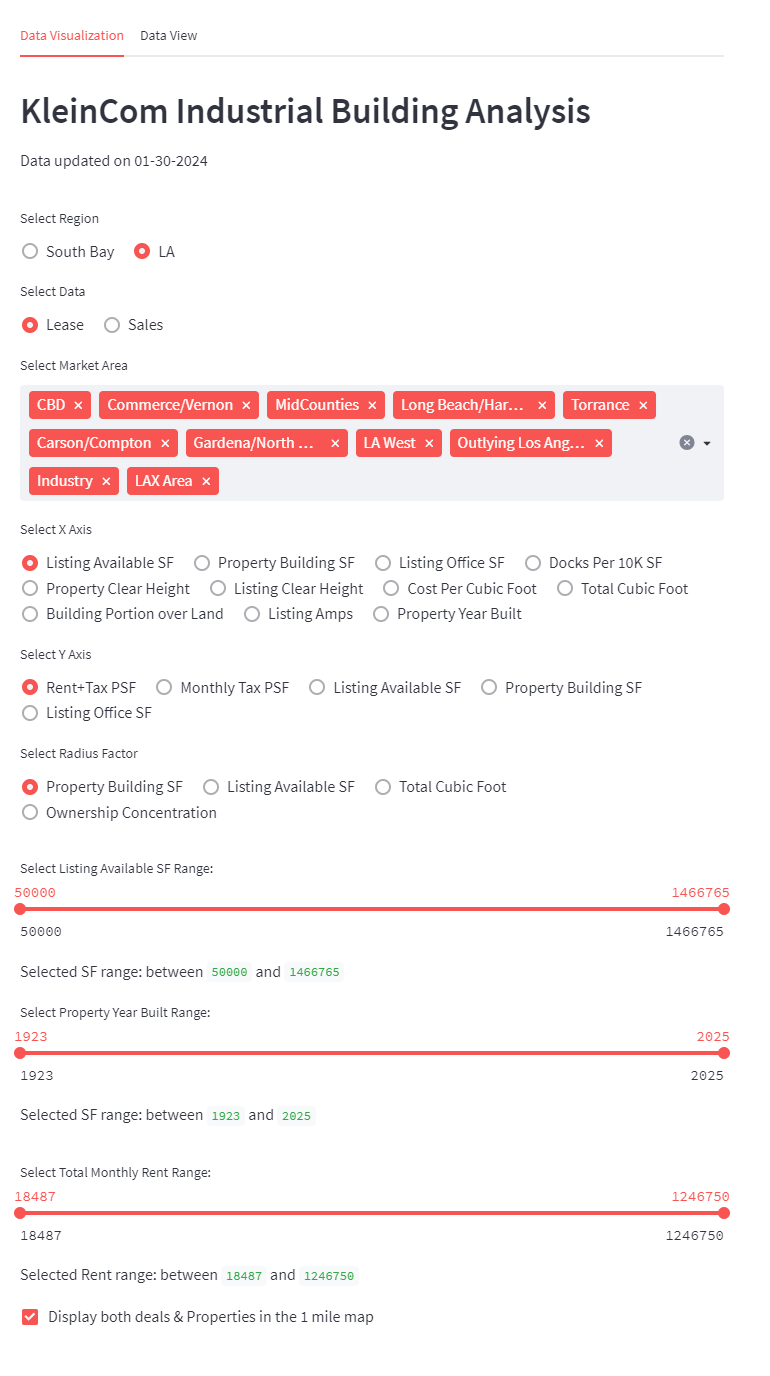
Streamlit Demo View
We model the entire market on the Kleincom Industrial Building Analysis we developed on Streamlit. For this report (100,000 SF to 250,000 SF), we identify 55 choices of which 14 are subleases with terms of at least 3 years (some up to 5). For demonstration purposes, we will leave aside, the additional 80 or so buildings in Inland Empire West (Rancho Cucomonga, Ontario, Chino, and Fontana) that meet the size requirement.
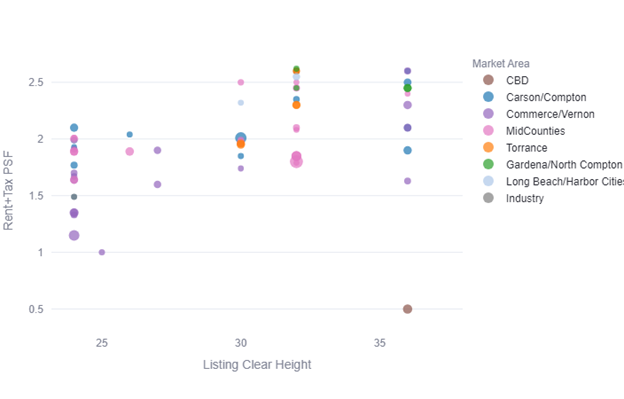
Using Ceiling Height with 24’ as the minimum, we establish the following distribution. For most tenants, 30’ to 32’ is the sweet spot.
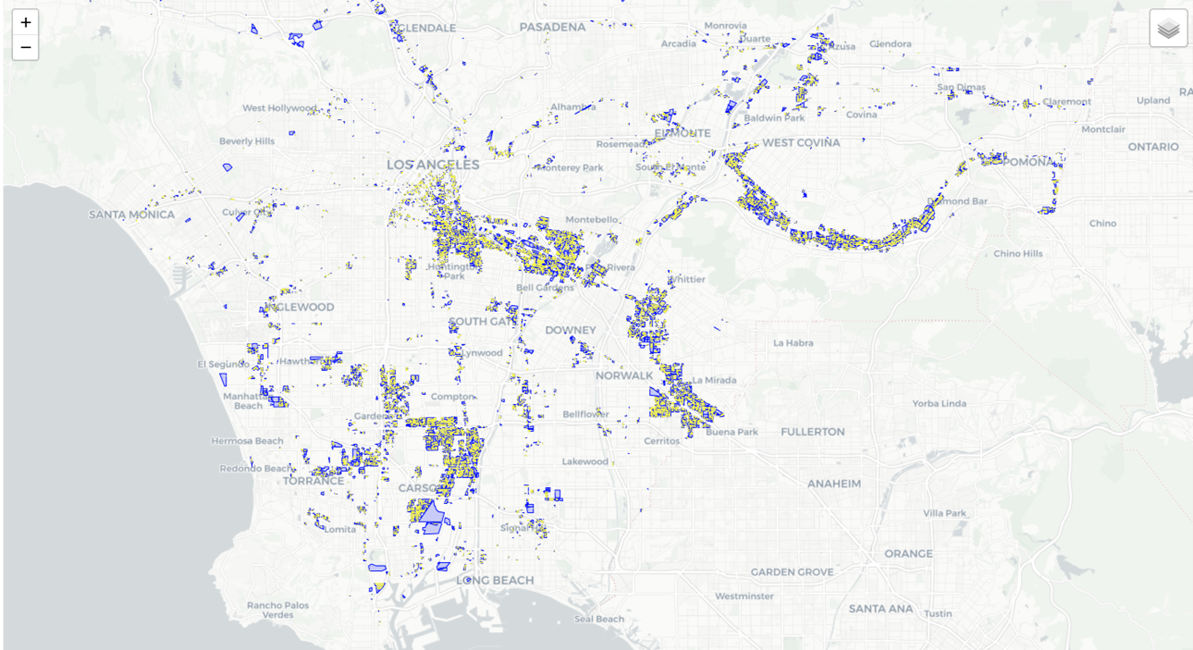
All Buildings 100K to 250K
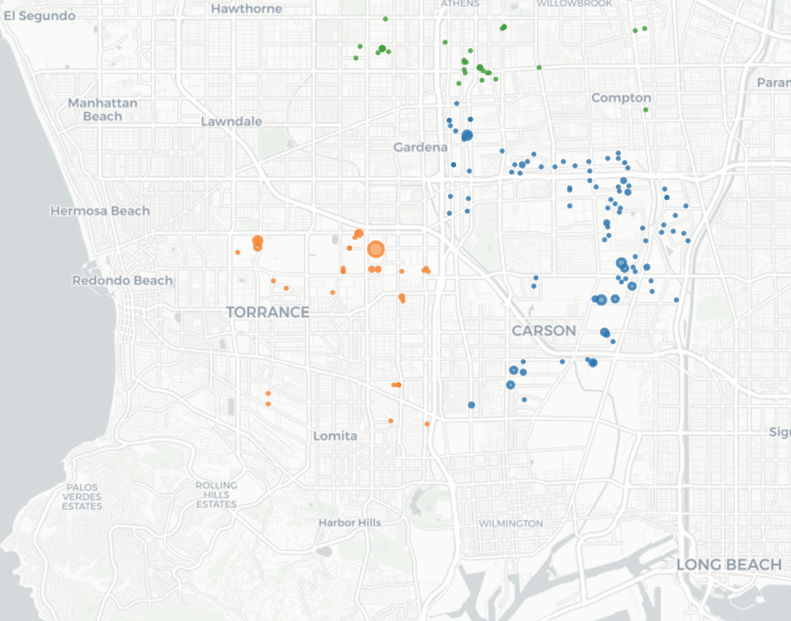
Buildings are dispersed over the entire Los Angeles Region.
Buildings 100k to 250K L.A. Basin
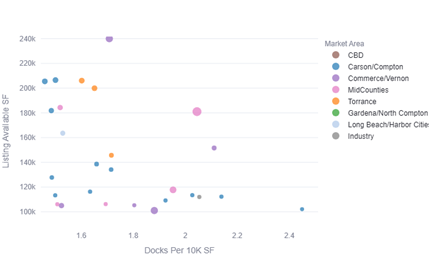
The second factor to sort the choices is the Loading Dock Ratio measuring docks per 10,000 square feet to determine loading efficiency. Any dock ratio greater than 1.5 doors/10,000 square feet is considered highly efficient and closer to 2 docks/10,000 SF is superior.
Docks Per 10k SF
Looking at the top results, it’s not always the newest buildings that are the best choices. You can lease 2nd or 3rd generation buildings for $1.75 to $1.95 per foot (all-in). About half of the buildings are 30’ or greater.
Results Table
Market Area
Size
Rate
Month
Clr
Year
Cubic Ft
Dock Ratio
B:L
Gardena/ Compton
300000
1.6
$480,000
26
1987
7800000
3.33
40%
Carson/Compton
300000
1.53
$459,000
25
1970
7500000
1.84
52%
Carson/Compton
285000
2.2
$627,000
32
2006
9120000
2.24
41%
Carson/Compton
250000
1.51
$377,500
25
1972
6250000
2.17
60%
MidCounties
250000
1.8
$450,000
32
2002
8000000
2.05
59%
Carson/Compton
150000
2.1
$315,000
36
2024
5400000
2.84
60%
Commerce/Vernon
150000
2.6
$390,000
36
2024
5400000
2.11
55%
For some tenant’s subleases may be the right answer because the terms are relatively short, and the financial commitment will be less. Ecommerce tenants and larger Amazon/Temu Sellers are drawn to subleases. The top subleases have exceptional loading and low property taxes. In most cases, landlords will renew when the lease expires.
Best Subleases
City
SF
Yr Blt
HGT
DH
Dock Ratio
Years Remaining
Carson
300000
1973
22
40
1.33
3.69
Industry
225000
1996
30
25
1.11
5.58
Torrance
200000
2000
30
30
1.50
2.69
Torrance
135000
2001
30
25
1.85
3.44
Commerce
125000
1957
22
55
4.40
5.28
Santa Fe Springs
120000
2003
30
30
2.50
3.78
La Mirada
100000
1997
30
20
2.00
2.44
Compton
100000
1981
24
15
1.50
3.02
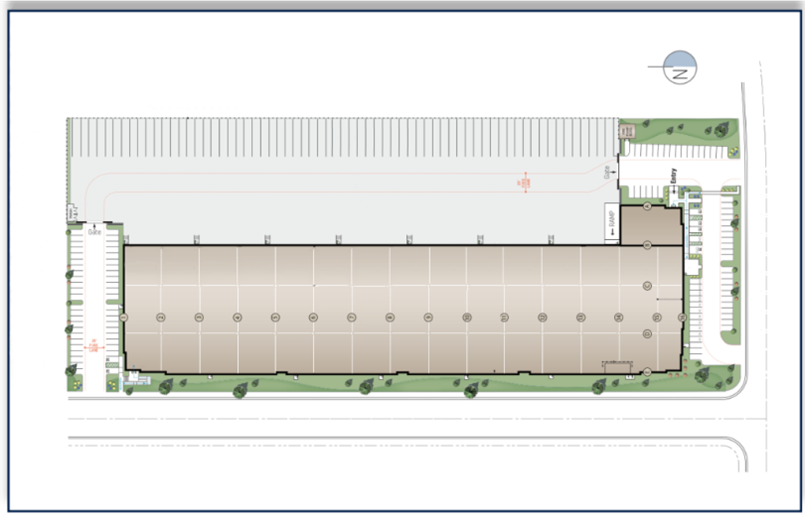
Experienced tenants will use site plans to decide. There is a preference for a more rectangular building than a square so you can load more trucks simultaneously and divided to sub-customers if necessary. Here’s an example of two buildings of approximately the same size and asking rent. Most tenants would prefer the first building because loading exceeds 2 docks per 10,000 square feet, it has additional trailer parking, and the warehouse can be easily divided into sections while maintaining optimum functionality.
The second site plan is reasonably functional but only has 1 dock per 10,000 square feet, can only be divided in half and is less functional than the first example. For the same cost, most tenants will choose the first building.
With the high cost of land and construction costs, developers need to maximize building coverage to compete and make a profit. In other words, developers are often forced to build the largest possible building on the site while doing their best to keep the building functional. As you can see, some buildings are more functional than others.
Every tenant has different priorities, but most revolve around the same criteria of location and function. At Klein Commercial, we have 40 years of corporate real estate experience locating the best buildings for our clients. Our latest tool, the Kleincom Industrial Building Analysis, will help you make the best choice amongst all the available space on the market today.
Industrial real estate is a diverse business that includes Investment funds, developers, private/family owners, corporations, occupiers, and a mix of product types and industries. Industrial buildings are in every community and are the source of employment, production, distribution, and wealth for many. The nation’s economic health rides on the success of industrial real estate.
There are several factors that are driving deals today. Broadly, these include Interest Rate Policy, US Industrial Strategy, and Local Municipal Governance. Everyone is affected differently. For example, higher interest rates are never good for real estate, though they affect sales more than leases; sale transactions are interest rate sensitive while leasing is supply and demand based. As an experienced broker, we use detailed knowledge, market analytics, and long-standing relationships to help you in making the best decision. Continue reading “How Is Industrial Real Estate Today?”
The industrial property business has grown from a real estate niche serving mostly large corporations and owner/users to a favored investment of large institutions. The rise coincided with the great manufacturing upheaval of shuttered plants as companies shifted production offshore. Goods return in containerized shipments and begat the new industry of logistics. The result was increased liquidity of both goods and capital. A situation that is ideal for warehouse development and investment. Today’s industrial marketplace is made up of global and national 3pls, shipping companies, e-commerce, and on the capital side, Industrial REITS, large investment funds, and a handful of developers. The Covid Supply Chain phenomena and an increase in tariffs has compounded an already unbalanced space market to acute levels Continue reading “2021 Remains an Unbalanced Industrial Market”
Streaming is the talk of Hollywood. The biggest adaption since television. Technology is replacing human decisions with lessons from on-line, eCommerce and subscription. It’s happening to industrial property. Real estate is already a superior cash streaming business, now with more means to enhance revenues. Visible effects of streaming appear with large space take-downs by studios and independent producers. Agency, too, is being disrupted because the value of data is surpassing personal relationships. Financial concentration and streaming technologies are creating a new real estate business. Virtual and artificial intelligence programs are essential to move forward in these new conditions. Continue reading “Streaming Industrial Real Estate”
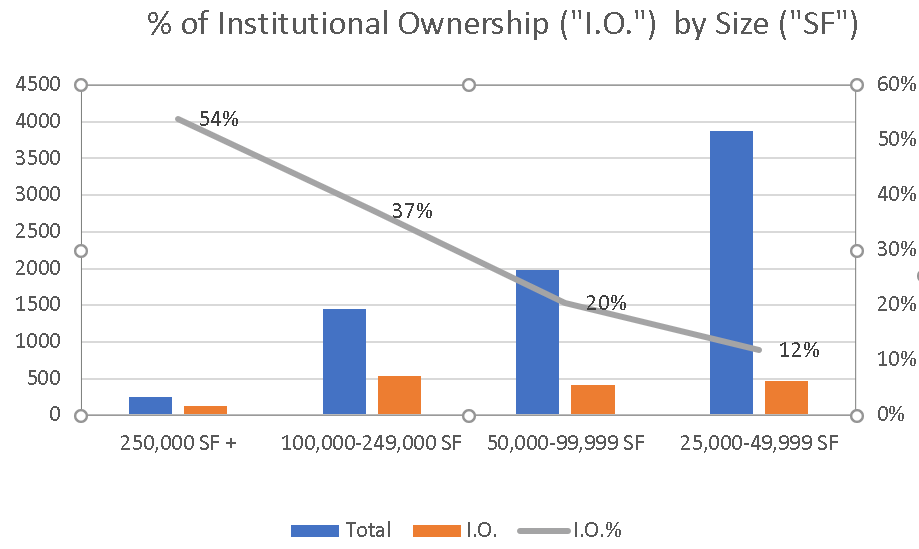
Every August, the Los Angeles Tax Assessor releases its annual Tax Roll that lists all ownership in Los Angeles County. This is valuable data and serves as an important part of our statistical analysis for the year. In other words, Tax Roll data helps us find properties to purchase. For Tax Year 2019/2020, the share of Institutional ownership increased in all size ranges, particularly larger buildings. For investment buyers, more focus on smaller buildings will be fruitful because there is less institutional concentration.
More so than ever before, cities are vying for companies that create jobs. There’s the policy aspect that favors clean and green jobs. Then there’s the backroom bargaining that favors successful outcomes. Companies that can offer employment would do well to study some of the recent newsworthy examples. They include the failed attempt by Los Angeles to attract AnseldoBreda, local jostling to snare Tesla Motors, competition for Eli Broad’s museum, Los Angeles Stadium in the City of Industry, and the smaller manufacturing deals coming through the CRA of Los Angeles. Each one is fairly lucrative to the company and does not necessarily fit any set model. They are similar to the large retailers, like Costco or Walmart, who were able to negotiate attractive packages for redevelopment funds, property tax breaks, and property development benefits. I haven’t seen any studies if these retail developments met city economic expectations, but certainly the recent raise in sales tax makes up any marginal differences. It pays to understand the multitude of incentives available from local, state and national agencies. Continue reading “Economic Development in Greater Los Angeles”
More and more, there is an element of global manufacturing that I call “shelled out” production. There are no signs on the building. There is no one in the office. The workers either pretend or truly can not speak English. The manufacturing is composed of sub-assembly and contract piece work. There is no one in charge and the workers don’t know where their goods will go. As soon as the customer changes its allegiance to a slightly lower cost provider, the entire operation can fold. Our manufacturing system is largely devolving to the manufactured part and who can make it the best and ship it the fastest. There is virtually no other measure. Continue reading “Global Manufacturing And Los Angeles”


.jpg)