How to Find the Best Industrial Building Today
How to Find the Best Industrial Building Today
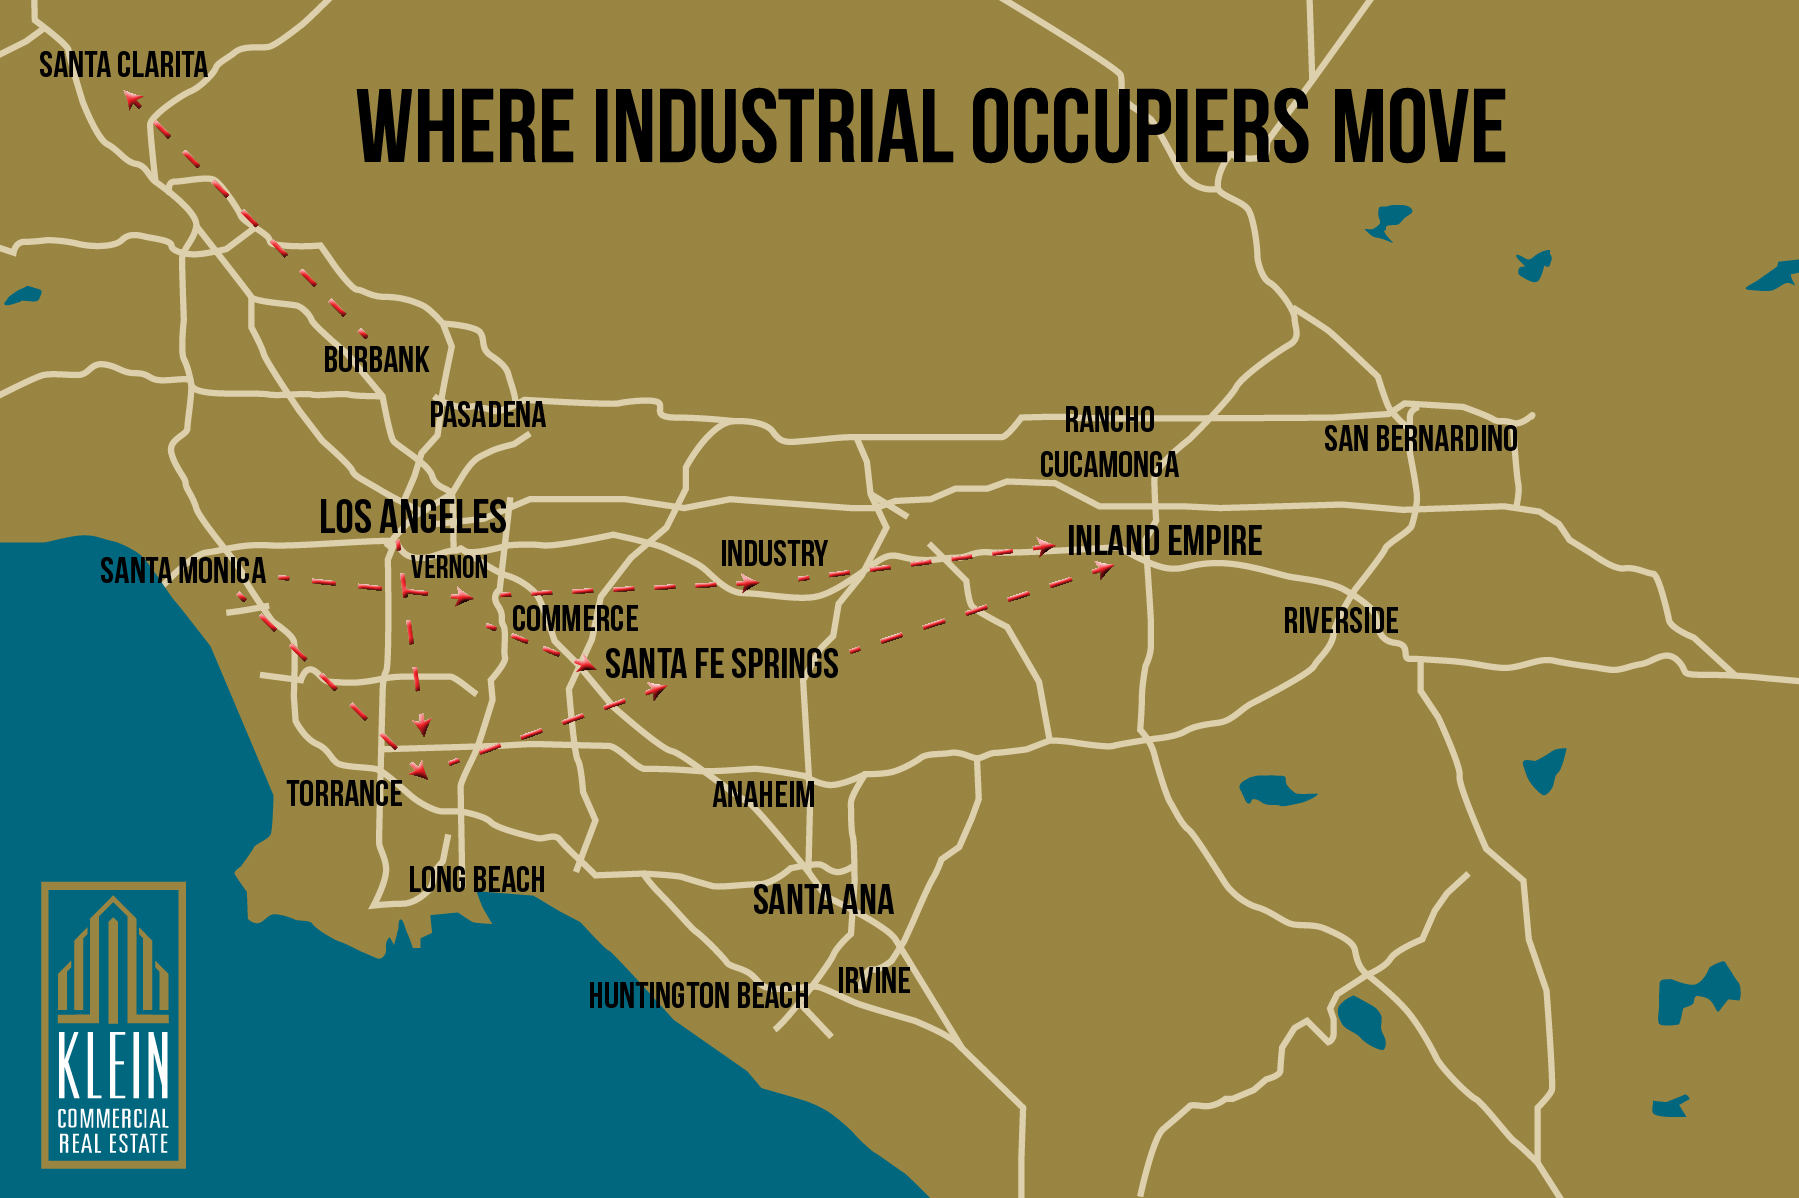
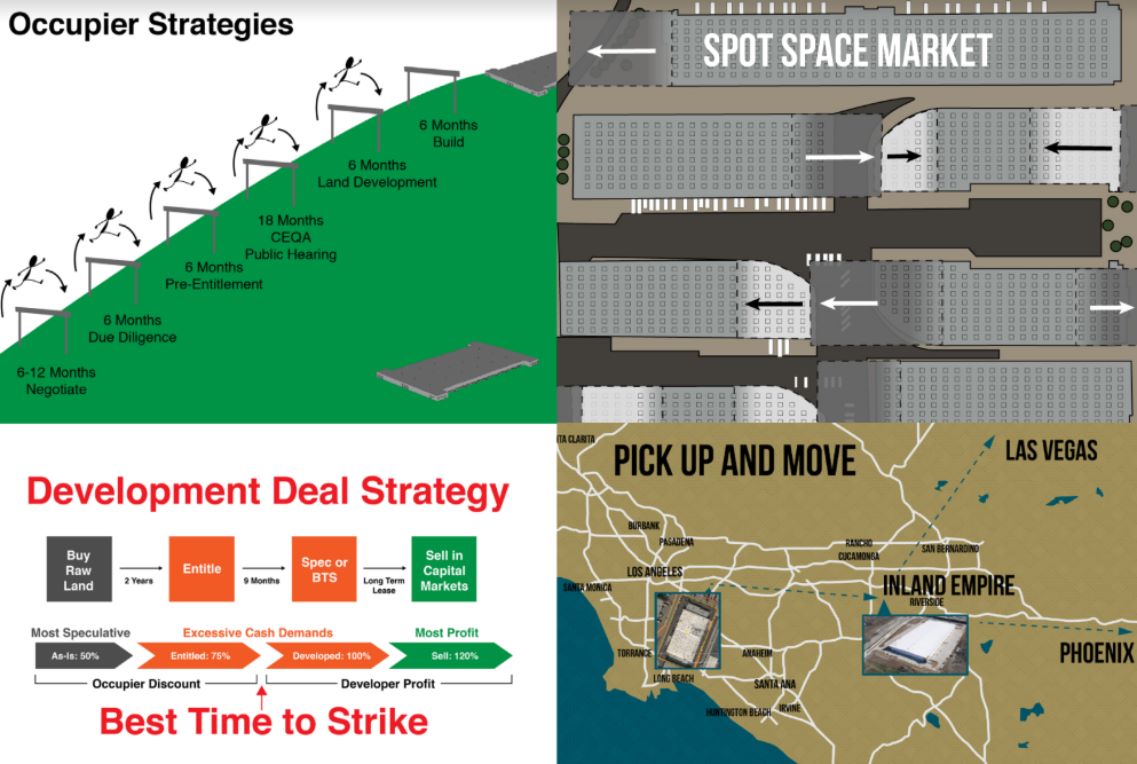
In less than 18 months, the industrial building market has shifted from low vacancy to abundancy. There are now 215 industrial spaces, greater than 50,000 square feet, available in the Greater Los Angeles Basin. This does not include Orange County, Inland Empire, or San Fernando Valley. Only the areas you see on the map (below). About 20% is sublease space.
The best value for most tenants is second and third generation spaces. Many of these buildings built since the year 2000 have the same characteristics as brand-new buildings except for ceiling heights, although many of these 2nd Gen buildings still go to 30’.
- 36’ high buildings came in around 2023
- 30’ – 32’ Clear was the norm starting in 2000
- 24’ Clear started as far back as 1975
Older buildings are equally functional as new buildings for less rent, especially if they have a low tax basis. One exception is if the tenant plans to install interior warehouse installations like mezzanines or specialty racking and automation. In these cases, latest generation buildings have an economic advantage because of height.
Some of the calculations we perform to determine functionality include:
- Location and Distance
- Docks per 10,000 SF
- Building to land ratio
- Cubic Capacity and Cost per Cube
- Property Taxes/Expenses
- Ceiling height
- Sublease
To identify the better buildings, we subject all available properties through a macro analysis. This is the best way to identify differences in functionality and cost when there are a lot of choices.
Here is an example:
Let’s say you are in 100,000 square feet in the South Bay and you want to double in size. Some tenants will move completely to put everything under one roof. Other tenants will look for a satellite building as an interim step. Most South Bay companies will look locally and as far as Santa Fe Springs and Mid Counties. Some will want to go as far as IE West. What will you find?
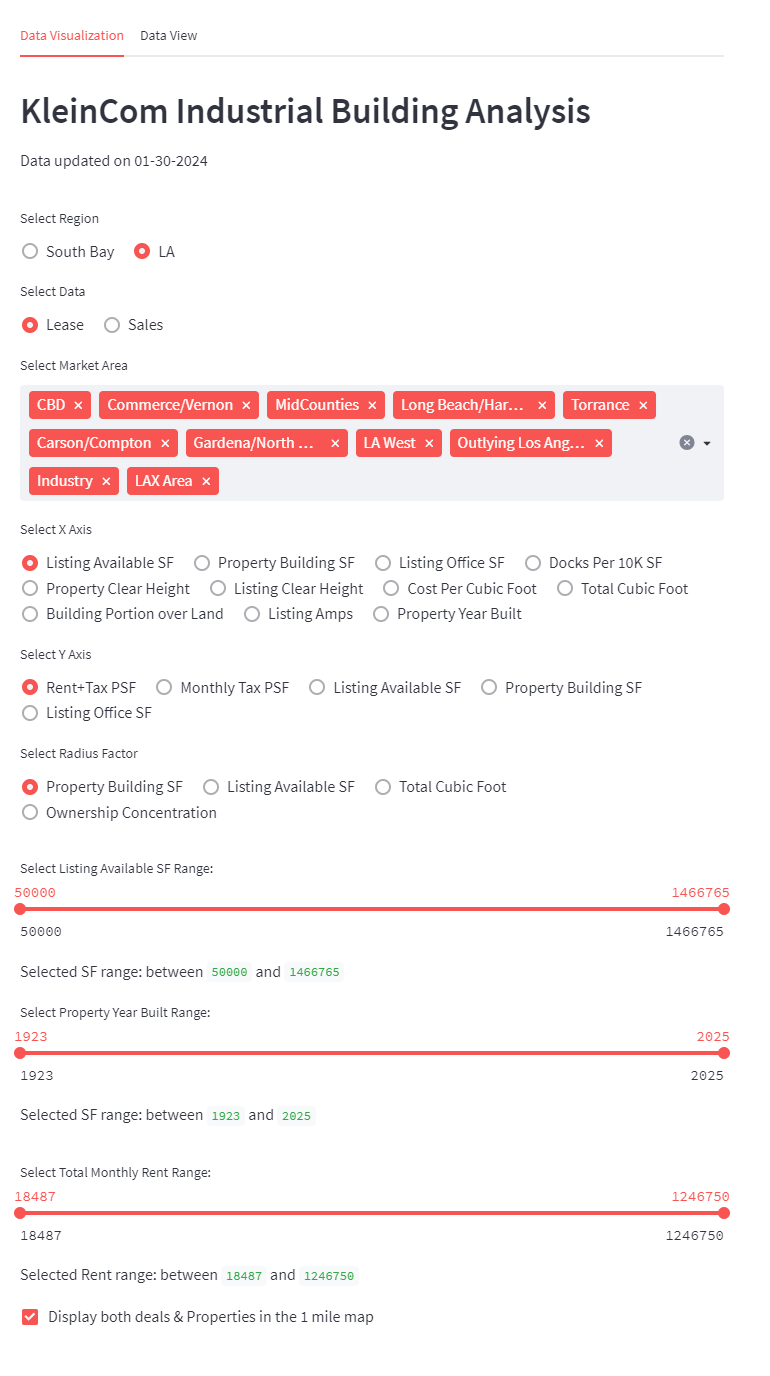
We model the entire market on the Kleincom Industrial Building Analysis we developed on Streamlit. For this report (100,000 SF to 250,000 SF), we identify 55 choices of which 14 are subleases with terms of at least 3 years (some up to 5). For demonstration purposes, we will leave aside, the additional 80 or so buildings in Inland Empire West (Rancho Cucomonga, Ontario, Chino, and Fontana) that meet the size requirement.
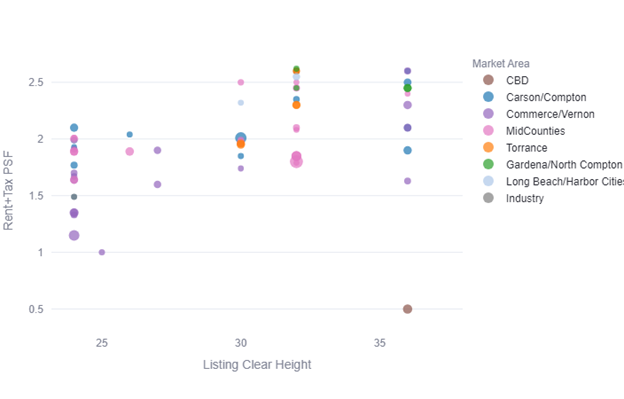
Using Ceiling Height with 24’ as the minimum, we establish the following distribution. For most tenants, 30’ to 32’ is the sweet spot.
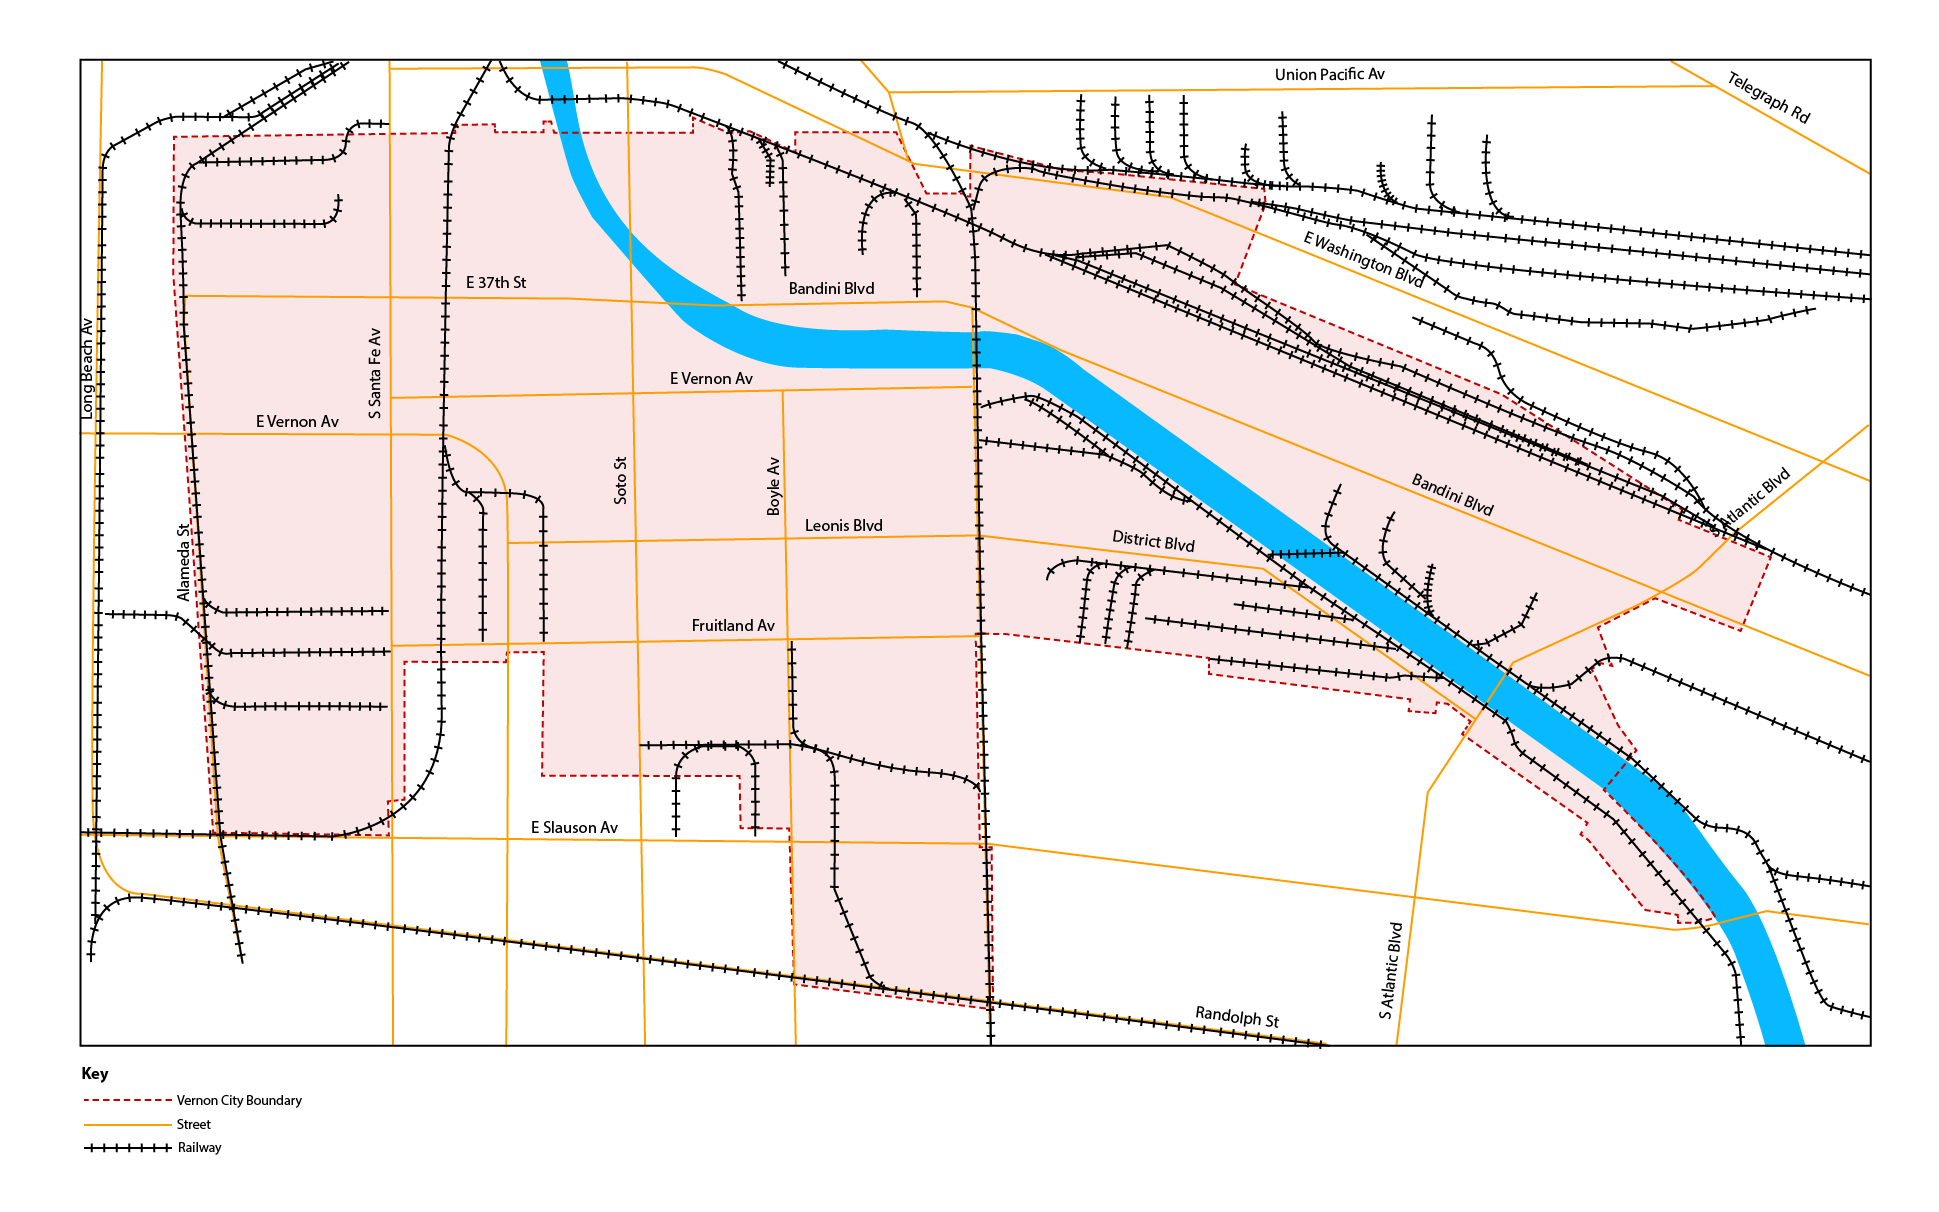
Buildings are dispersed over the entire Los Angeles Region.

The second factor to sort the choices is the Loading Dock Ratio measuring docks per 10,000 square feet to determine loading efficiency. Any dock ratio greater than 1.5 doors/10,000 square feet is considered highly efficient and closer to 2 docks/10,000 SF is superior.
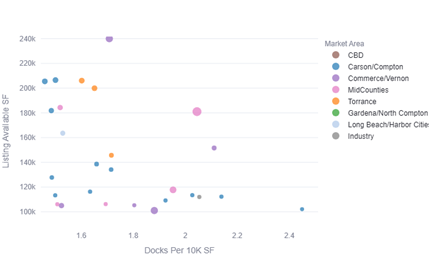
Looking at the top results, it’s not always the newest buildings that are the best choices. You can lease 2nd or 3rd generation buildings for $1.75 to $1.95 per foot (all-in). About half of the buildings are 30’ or greater.
| Market Area | Size | Rate | Month | Clr | Year | Cubic Ft | Dock Ratio | B:L |
|---|---|---|---|---|---|---|---|---|
| Gardena/ Compton | 300000 | 1.6 | $480,000 | 26 | 1987 | 7800000 | 3.33 | 40% |
| Carson/Compton | 300000 | 1.53 | $459,000 | 25 | 1970 | 7500000 | 1.84 | 52% |
| Carson/Compton | 285000 | 2.2 | $627,000 | 32 | 2006 | 9120000 | 2.24 | 41% |
| Carson/Compton | 250000 | 1.51 | $377,500 | 25 | 1972 | 6250000 | 2.17 | 60% |
| MidCounties | 250000 | 1.8 | $450,000 | 32 | 2002 | 8000000 | 2.05 | 59% |
| Carson/Compton | 150000 | 2.1 | $315,000 | 36 | 2024 | 5400000 | 2.84 | 60% |
| Commerce/Vernon | 150000 | 2.6 | $390,000 | 36 | 2024 | 5400000 | 2.11 | 55% |
For some tenant’s subleases may be the right answer because the terms are relatively short, and the financial commitment will be less. Ecommerce tenants and larger Amazon/Temu Sellers are drawn to subleases. The top subleases have exceptional loading and low property taxes. In most cases, landlords will renew when the lease expires.
| City | SF | Yr Blt | HGT | DH | Dock Ratio | Years Remaining |
|---|---|---|---|---|---|---|
| Carson | 300000 | 1973 | 22 | 40 | 1.33 | 3.69 |
| Industry | 225000 | 1996 | 30 | 25 | 1.11 | 5.58 |
| Torrance | 200000 | 2000 | 30 | 30 | 1.50 | 2.69 |
| Torrance | 135000 | 2001 | 30 | 25 | 1.85 | 3.44 |
| Commerce | 125000 | 1957 | 22 | 55 | 4.40 | 5.28 |
| Santa Fe Springs | 120000 | 2003 | 30 | 30 | 2.50 | 3.78 |
| La Mirada | 100000 | 1997 | 30 | 20 | 2.00 | 2.44 |
| Compton | 100000 | 1981 | 24 | 15 | 1.50 | 3.02 |
Experienced tenants will use site plans to decide. There is a preference for a more rectangular building than a square so you can load more trucks simultaneously and divided to sub-customers if necessary. Here’s an example of two buildings of approximately the same size and asking rent. Most tenants would prefer the first building because loading exceeds 2 docks per 10,000 square feet, it has additional trailer parking, and the warehouse can be easily divided into sections while maintaining optimum functionality.
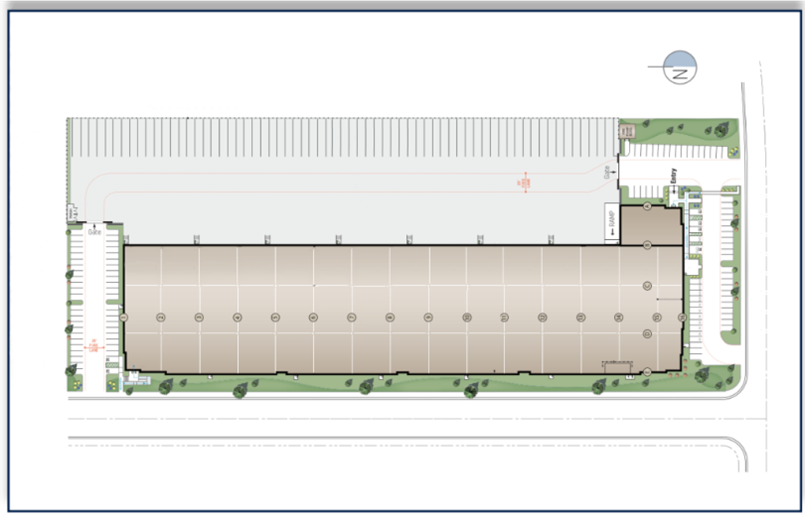
The second site plan is reasonably functional but only has 1 dock per 10,000 square feet, can only be divided in half and is less functional than the first example. For the same cost, most tenants will choose the first building.

With the high cost of land and construction costs, developers need to maximize building coverage to compete and make a profit. In other words, developers are often forced to build the largest possible building on the site while doing their best to keep the building functional. As you can see, some buildings are more functional than others.
Every tenant has different priorities, but most revolve around the same criteria of location and function. At Klein Commercial, we have 40 years of corporate real estate experience locating the best buildings for our clients. Our latest tool, the Kleincom Industrial Building Analysis, will help you make the best choice amongst all the available space on the market today.