Race for Space – The New Dynamism

Race for Space – The New Dynamism

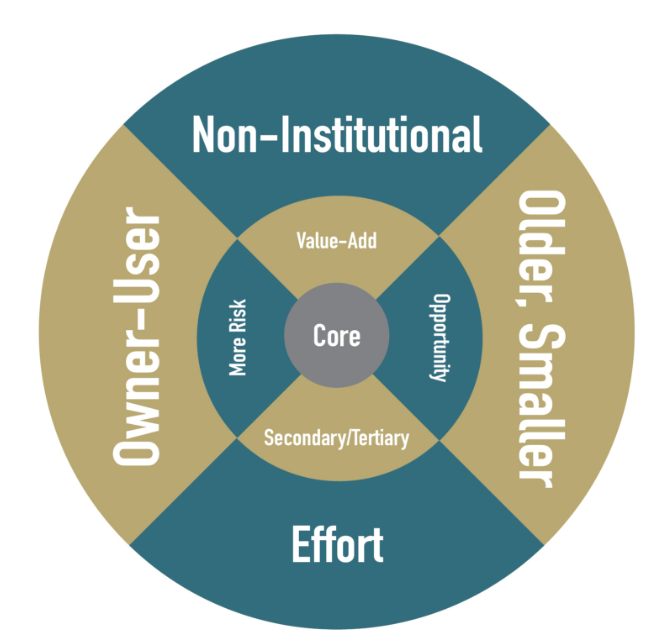
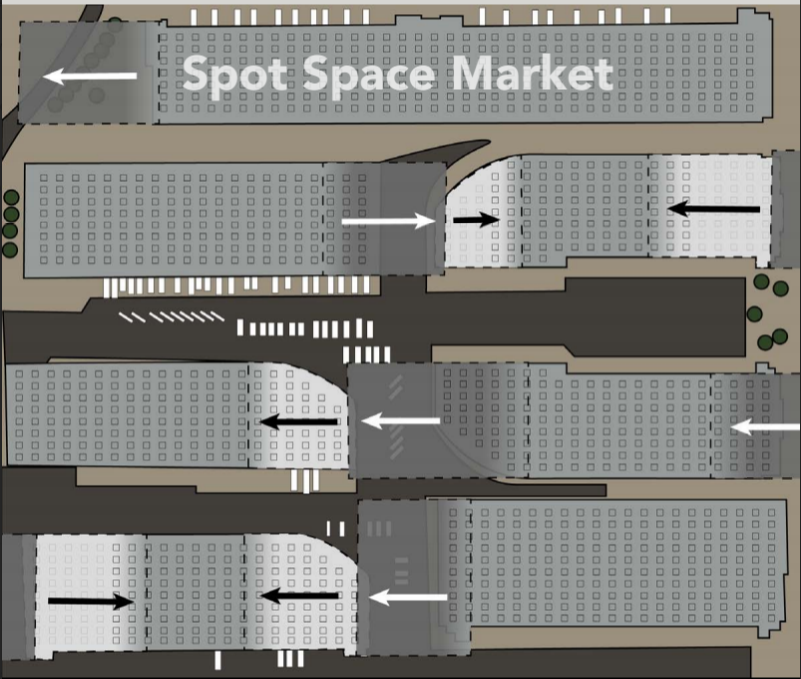
Dynamic pricing is becoming a greater influence on space leasing and building sales. By dynamism, I mean fluctuating rents separate from conventional underwriting. A “spot market” is emerging to satisfy demand for smaller, flexible, and elastic spaces. Many examples include Truck Yards, Warehouse Sharing, Creative, Cannabis, and other categories of sub-space where “street rents” are disconnected from contract rents. WeWork and Amazon are two primary examples that contract with the Landlord at one rent, and lease out space bits at higher rents. Public Warehouses, Self-Storage, Swap Meets, Studios and Truck Yards operate along the same model by collecting additional rent by offering “alternative occupancies” with varying degrees of added services. The revolution is any building can be pieced out especially with easily acquired technology that can create “smart” buildings for automation, surveillance, and access.
Continue reading “Race for Space – The New Dynamism”

Winter News 2016 – Industrial Real Estate Profits

Winter News 2016 – Industrial Real Estate Profits

development Deal Strategy

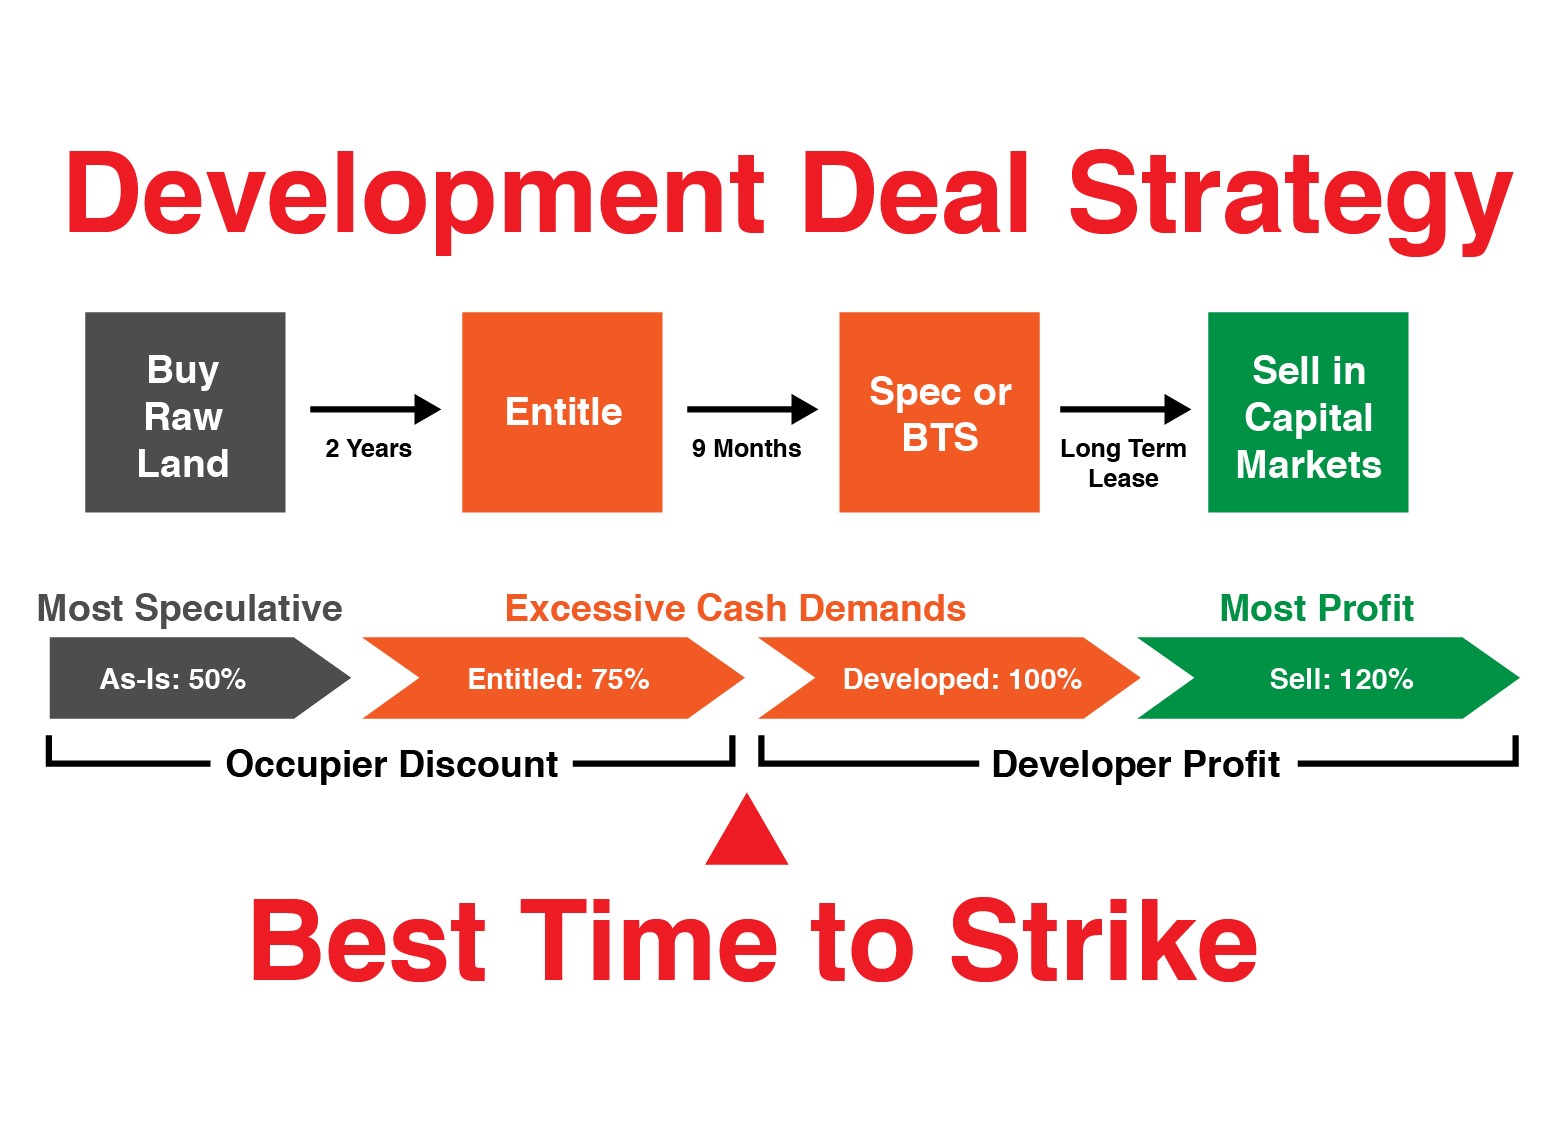
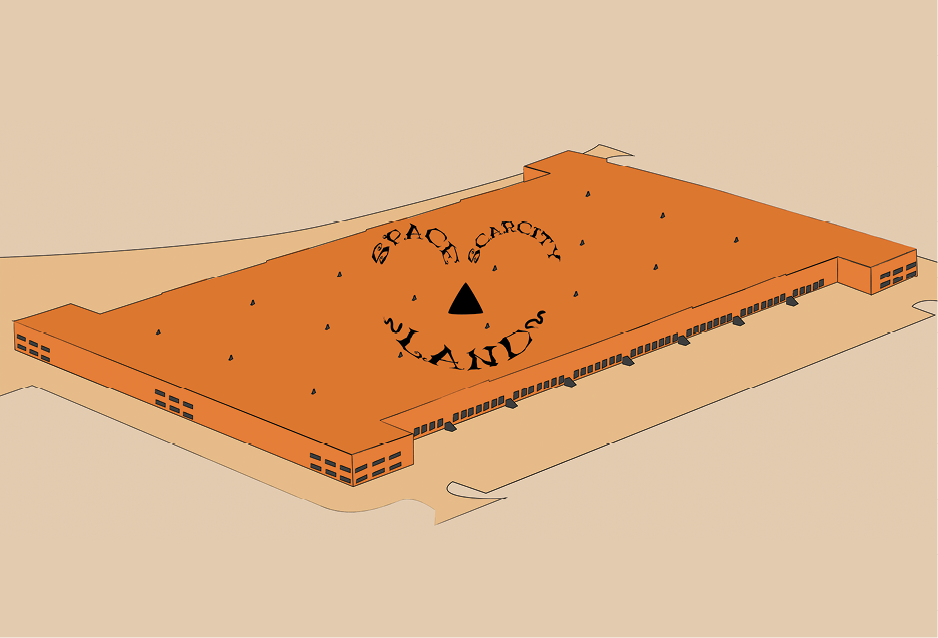
The current cycle is being propelled by three major conditions: Space Scarcity, Capital Markets Pressure and Rent Surge. Market dynamics are still very favorable for development and will only be disrupted if demand begins to weaken. Otherwise, strong fundamentals are the prevalent condition in most major U.S. markets.
Continue reading “Winter News 2016 – Industrial Real Estate Profits”

Looking at US Industrial with the US Cluster Mapping Project

Looking at US Industrial with the US Cluster Mapping Project

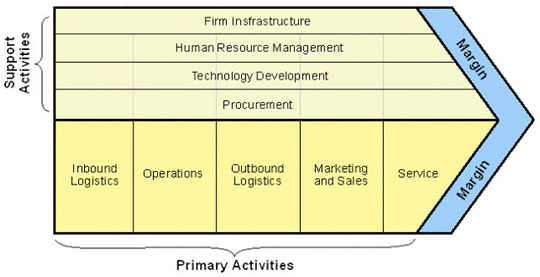
The Cluster Mapping Project (CMP) was pioneered by Michael E Porter of Harvard University. He is just as well known for his works on Competitive Advantage. His work is a necessary foundation for US Industry and business organizations. I reprint his Value Chain diagram below for company diagnostics, which has been repurposed to examine the competitiveness of regions. To understand the implications of location and clustering, you can read an article Professor Porter published in 1995 about the strategic location of inner cities which is just as relevant today.


Continue reading “Looking at US Industrial with the US Cluster Mapping Project”

Real Estate Deals in the GIS and Data Universe

Real Estate Deals in the GIS and Data Universe

Good technology can improve real estate deal making. This article describes my experience with Geographical Information Systems (GIS) and how it has become a fundamental tool for my business. At its simplest, GIS programs are a visual adjunct to database and contact management programs. However, if used to its fullest, GIS can crystalize multiple property relationships to monetize real estate information by traditional forms of deal making, solve complicated problems and create new business models.

Continue reading “Real Estate Deals in the GIS and Data Universe”

Questions About The End of California Redevelopment

Questions About The End of California Redevelopment

We are starting an extremely interesting and confusing period as redevelopment agencies (RDAs) come to an end. Firstly, RDAs were a powerful force in every city’s arsenal. They employed large staffs and had enormous budgets. A lot of the built commercial world is attributable to redevelopment through direct land contribution, infrastructure, subsidies, guarantees, loans or other physical or financial contributions. RDAs created a lot of very good development that would not have otherwise been built. High quality, low income housing units were developed. Many private and capable developers profited.

Continue reading “Questions About The End of California Redevelopment”

HOW ARE THINGS LOOKING?

HOW ARE THINGS LOOKING?

Customers always ask me, “How do things look?” Here’s one way to answer. In this roughly one square mile grid of Broadway/Rosecrans, there are about 120 buildings of decent size. I count 25 that have availability. Perhaps not the entire buildings are on the market, but enough to depict this picture. That’s about 20% of the buildings with significant availability. I’m working on a lease in Chatsworth and there is even more yellow. This is a pretty consistent picture throughout Los Angeles. In contrast, there have been times when there is no yellow.

Continue reading “HOW ARE THINGS LOOKING?”

KLEIN NEWS FALL 2010

KLEIN NEWS FALL 2010

Activity Is Up, But Far From Celebratory

With the year of fear behind us and summer doldrums over, should we expect an increase of activity? Compared to the past two years of bad news, yes, activity is up. Many businesses that were paralyzed with fear are now investigating opportunities in the property market. Private companies are looking for space just in time to replace the waning influence of government stimulus. For instance, businesses that can access low interest rates are in a particularly enviable position. The evidence is demonstrated by a few stellar deals that were purchased by a few brave souls who struck when no one else could. Now that the great fear has receded, we are left with a bad market instead of a catastrophic one. Buyers and Tenants are coming out of their shell to see if they can find bargains and re-launch business plans.
Continue reading “KLEIN NEWS FALL 2010”

INTRODUCING MAPP 1.0

INTRODUCING MAPP 1.0

 
Over the summer we created a commercial real estate mapping application that combines the important commercial real estate information  for Los Angeles County in one place. It is designed to help buyers, tenants, developers, and investors get a spatial view of the real estate commitment they are about to make. We call this map application MAPP 1.0.
Continue reading “INTRODUCING MAPP 1.0”