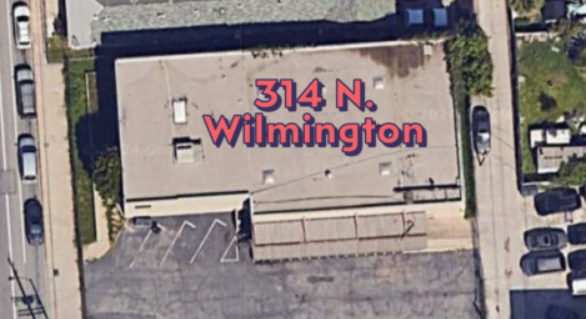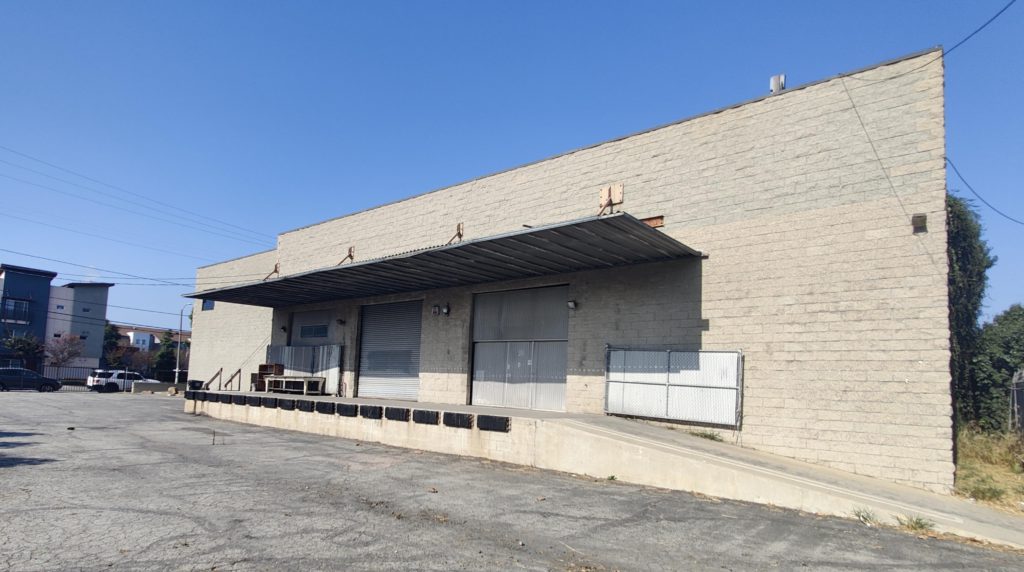


FAQ on Allowable Uses for 314 N. Wilmington Blvd., Wilmington, CA (City of L.A.)
FAQ on Allowable Uses for 314 N. Wilmington Blvd.
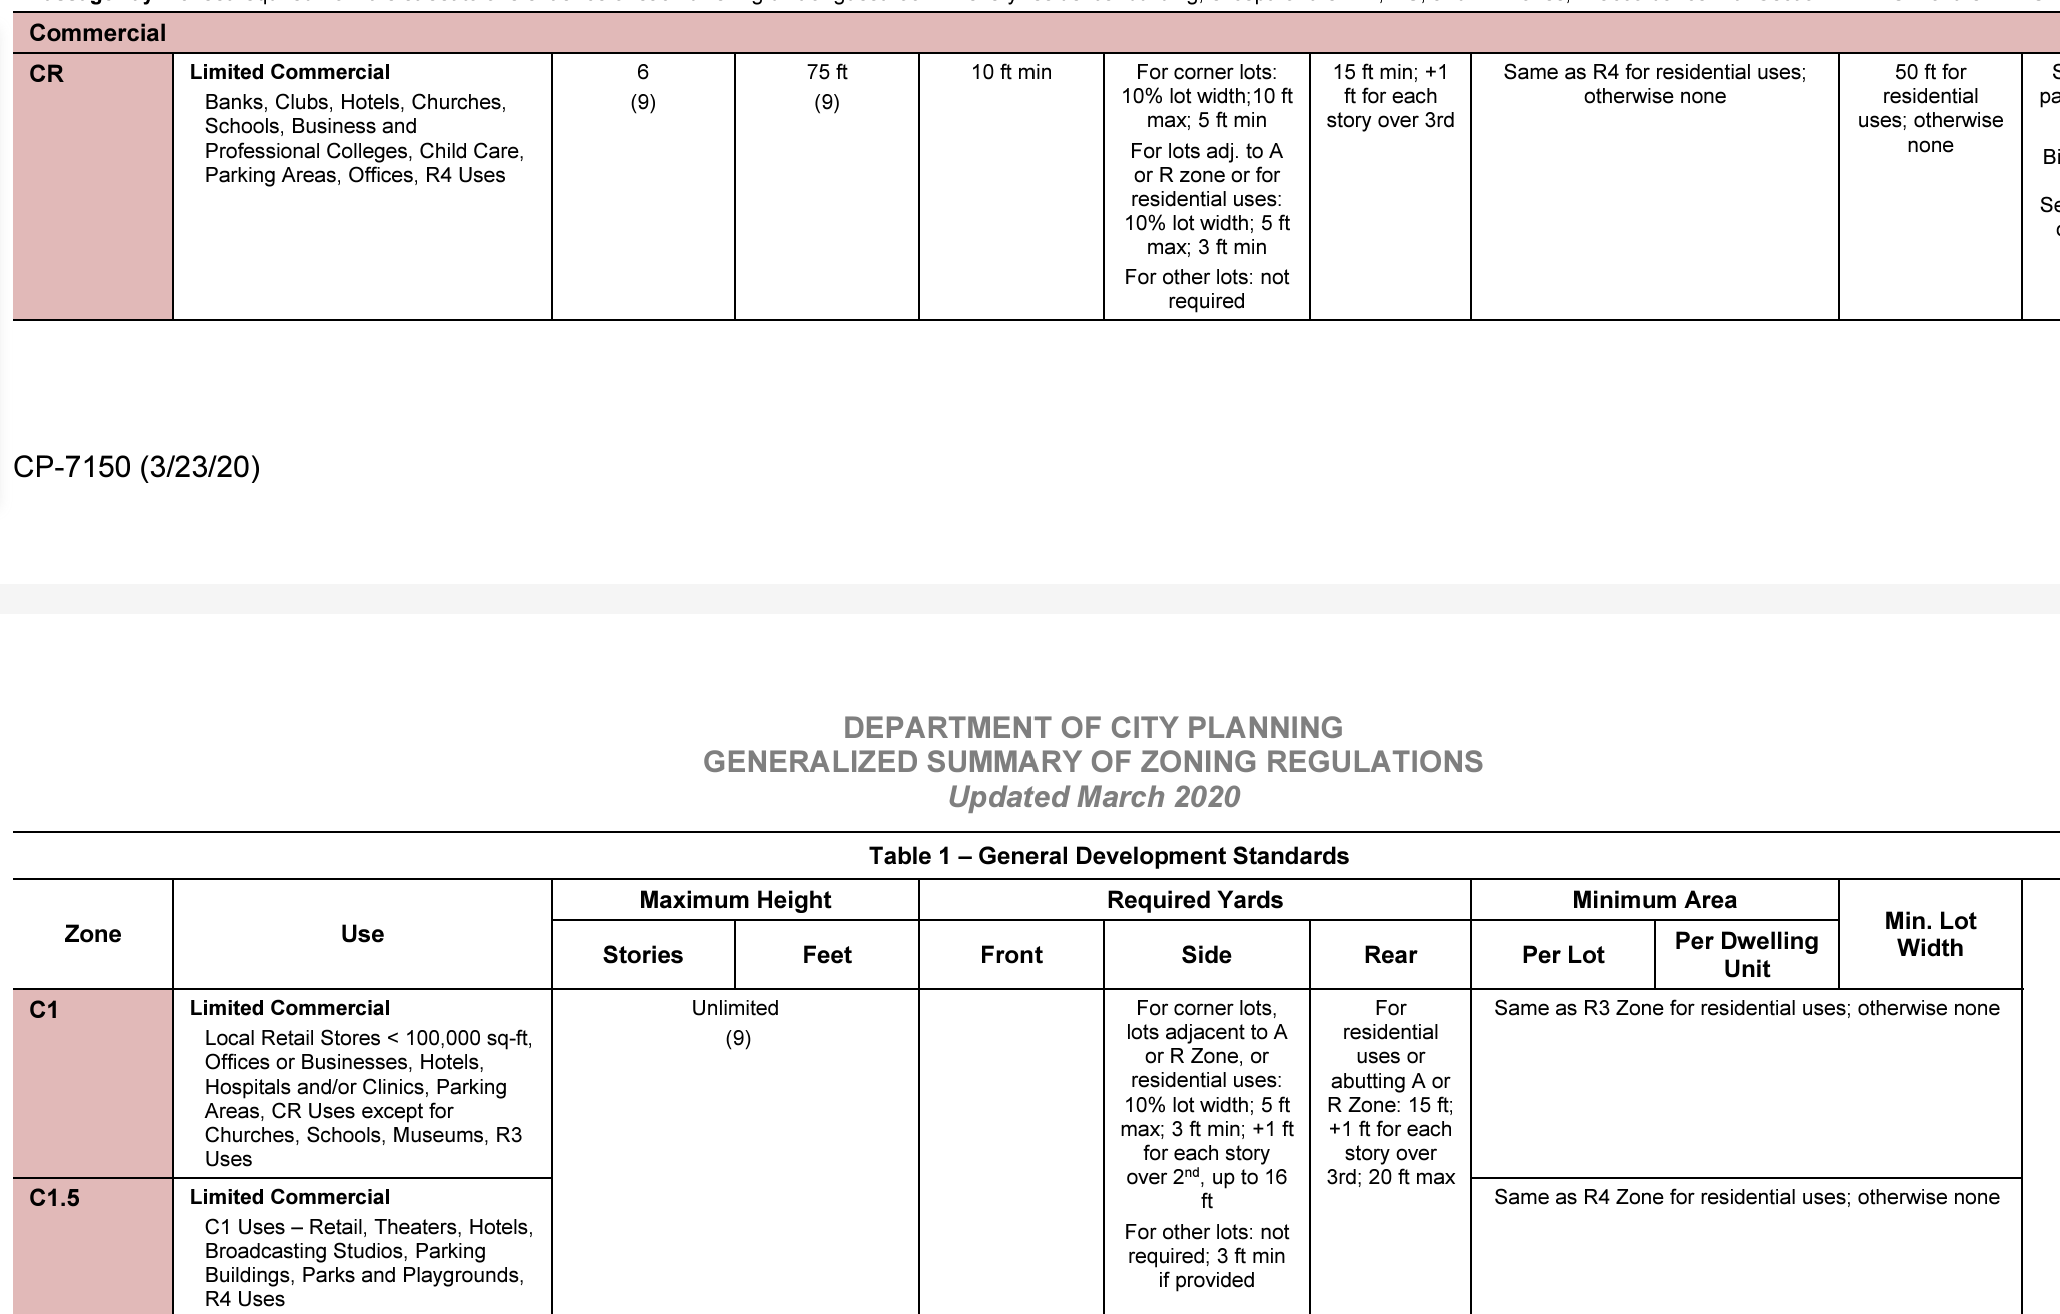
1. **What types of businesses are allowed under [Q]C1.5-1VL-O-CUGU zoning?**
– Retail shops (e.g., building supplies, specialty goods).
– Office spaces for professional services (e.g., medical, legal).
– Community-oriented businesses (e.g., art galleries, fitness studios).
– Small-scale manufacturing with a retail component (e.g., furniture making).
– Eco-friendly or green businesses (e.g., urban agriculture, solar equipment).
2. **Can the building be used for logistics or warehousing?**
– Traditional logistics hubs are not permitted. However, small-scale storage or inventory for retail operations is allowable.
3. **Is ship chandlery a permitted use?**
– Yes, if it operates as a retail/service business providing goods for ships and aligns with C1.5 zoning and CUGU standards.
4. **What restrictions apply to the building?**
– Building height is limited to 45 feet.
– Floor Area Ratio (FAR) is capped at 1.5:1.
– Operations must comply with the Clean Up Green Up (CUGU) overlay.
5. **What uses are NOT allowed under this zoning?**
– Heavy industrial operations, large-scale logistics, or truck yards.
– Any use generating significant noise, pollution, or traffic incompatible with residential proximity.
6. **Can zoning modifications be requested?**
– Buyers can apply for a Conditional Use Permit (CUP) or zoning variance for specific uses not
explicitly allowed.
For further clarification or assistance, contact the City of Los Angeles Planning Department or reach
out to us direct. This FAQ prepared by ChatGPT.

Buyer-Broker Agreements Are Now A California Mandate – 2025
Buyer-Broker Agreements Are Now A California Mandate – 2025
As of the start of 2025, all buyers being represented by a broker will need to agree in writing regarding their business and transactional relationship. In many cases, the broker’s compensation is now being shifted to the buyer. There will be a lot of explaining to do if a buyer wants experienced representation. California Civil Code §1670.50, effective January 1, 2025, mandates that real estate agents representing buyers enter into a written “buyer-broker representation agreement” with their clients. This agreement must be executed as soon as practicable, but no later than when the buyer submits an offer to purchase real property.
Key Provisions in a Buyer-Broker Agreement Include:
- Broker’s Compensation
- Clearly state how the broker will be compensated for their services.
- Include the amount or method of calculation (e.g., a fixed fee, percentage of the purchase price, or other arrangements).
- Specify whether the compensation is contingent on the completion of a transaction or is payable under other conditions.
- Services to Be Provided
- Detail the specific services the broker agrees to provide to the buyer, such as property searches, negotiations, or assistance with purchase contracts.
- Payment Conditions
- Clarify the conditions under which compensation becomes payable, including:
- Whether payment depends on the successful closing of a transaction.
- Responsibility for compensation if the seller offers to pay part or all of the buyer’s broker’s fees.
- Clarify the conditions under which compensation becomes payable, including:
- Contract Duration
- For agreements with individual buyers, limit the duration of the agreement to no more than three months.
- Prohibit automatic renewals of the agreement.
- State that any extensions must be in writing and signed by all parties.
- Termination Clause
- Include conditions under which either party may terminate the agreement.
- Address the buyer’s obligations regarding compensation if the agreement is terminated before a transaction is completed.
- Legal Disclosure Requirement
- Attach or reference the required buyer representation disclosure form as specified in Section 2079.14. This ensures the buyer understands their rights and obligations.
- Signatures
- Include the signatures of all parties (buyer and broker) to validate the agreement.
- Governing Law and Dispute Resolution
- Optionally include provisions regarding governing law (California law) and how disputes will be resolved (e.g., mediation, arbitration, or litigation).
Additional Notes on Compensation
- The agreement should address how compensation will be handled if the buyer purchases a property without the broker’s involvement.
- If a seller or another broker offers compensation, the agreement should clarify whether this reduces the buyer’s obligation to compensate their broker.
AIRCRE has developed two forms for both exclusive and non-exclusive agreements. Both are detailed and protect the broker. I will be curious to see how fund-level investors treat this mandate. First Tuesday has also developed a similar form that is simpler to use. I’m debating which of the two versions is more practical. In either case, we’ve been instructed by our legal counsel to prepare an addendum for every property that is submitted. California has added a layer of complexity to every deal. There is an opportunity in this legislation to modernize our brokerage process, but more about that another time.

Industrial Building Sales
The Los Angeles industrial real estate market is financialized. That means pricing reflects accepted investment principles. Investment buyers, flush with private capital, are searching for smaller and older buildings than what you would normally expect from fund level buyers. Assets owned by individuals, corporations, families, and partnerships are being sold to large investment groups, funds, and REITS. It started with “Class A” buildings but escalated for almost all industrial buildings with low interest rates after the Great Financial Crisis. Activity surged during Covid, levelled off during the recent period of higher interest rates, and is regaining strength with more capital allocations hitting almost all industrial properties that generate long-lasting income.
In our experience, some building owners prefer comprehensive marketing and others want discretion. We developed our resources to do both:
| Conventional Listing | Private Listing |
|---|---|
| Exclusive | Non-Exclusive |
| Market Rate Broker Fee | Lower Broker Fee |
| Generally, No Dual Agency | Dual-Agency |
| Common with Owner/Users | Common with Investor/Developer Sales |
| No Immediate Hurry | Deadline |
| Public – Wider Distribution | Confidential and Discrete |
| Dedicated effort and resources | Flexibility – Can sell yourself |
| Posted online and through Industrial Multiple | Distributed to professional buyers |

The Sweet Spot in Industrial Buildings
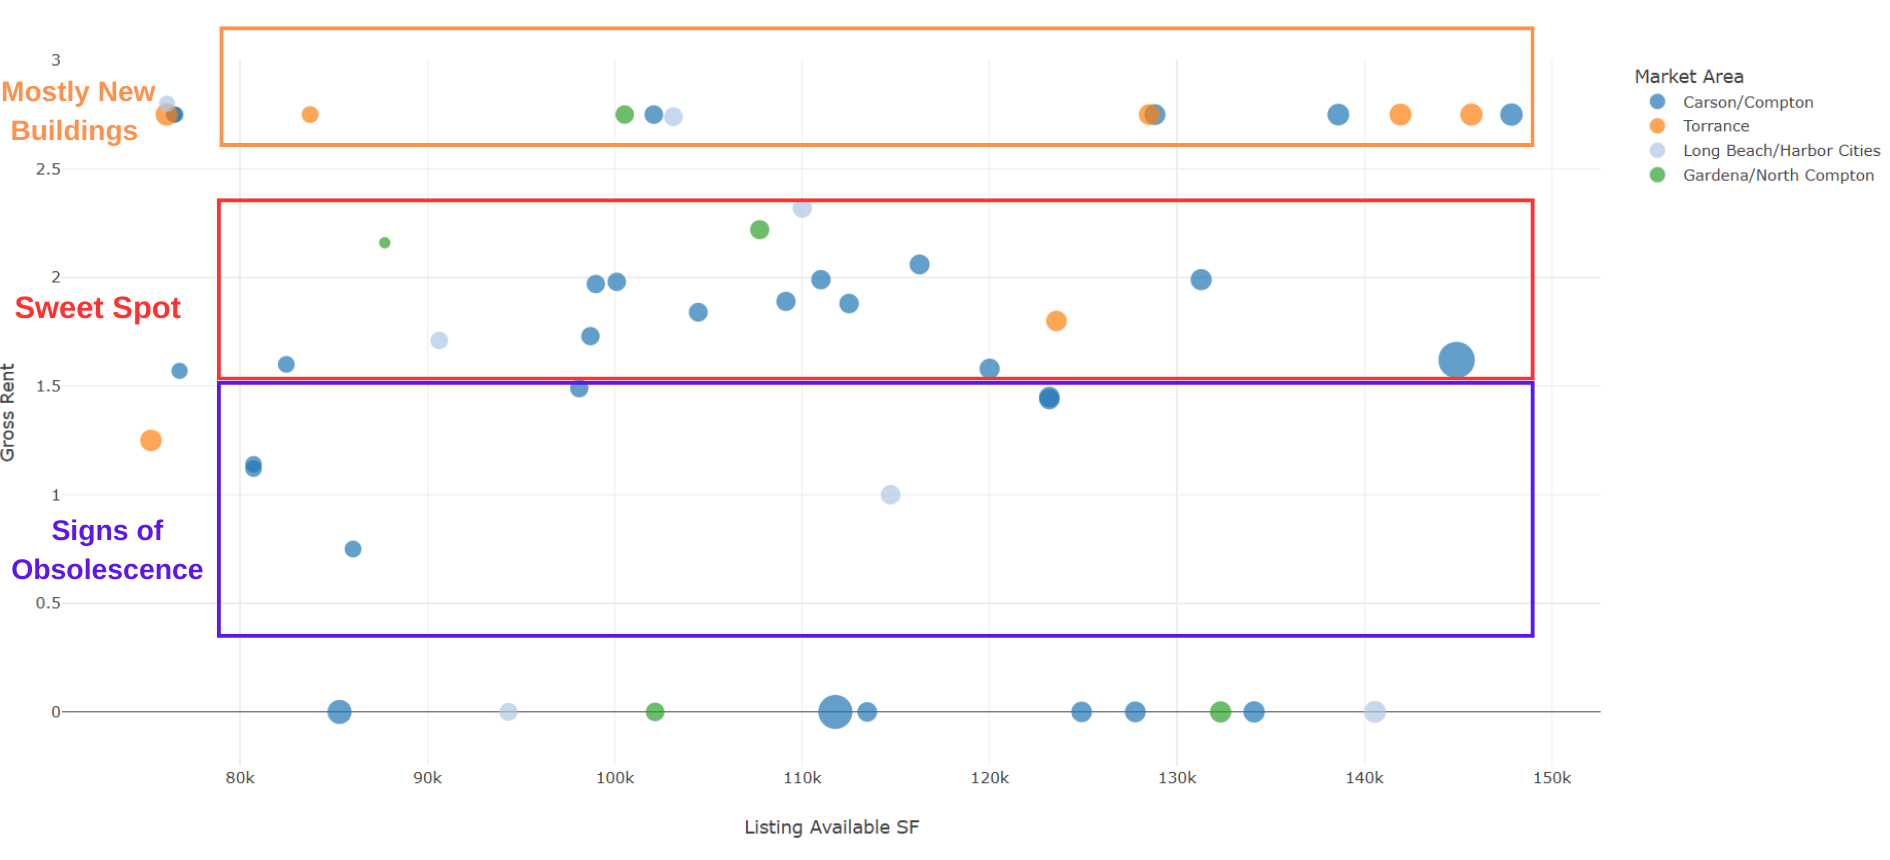
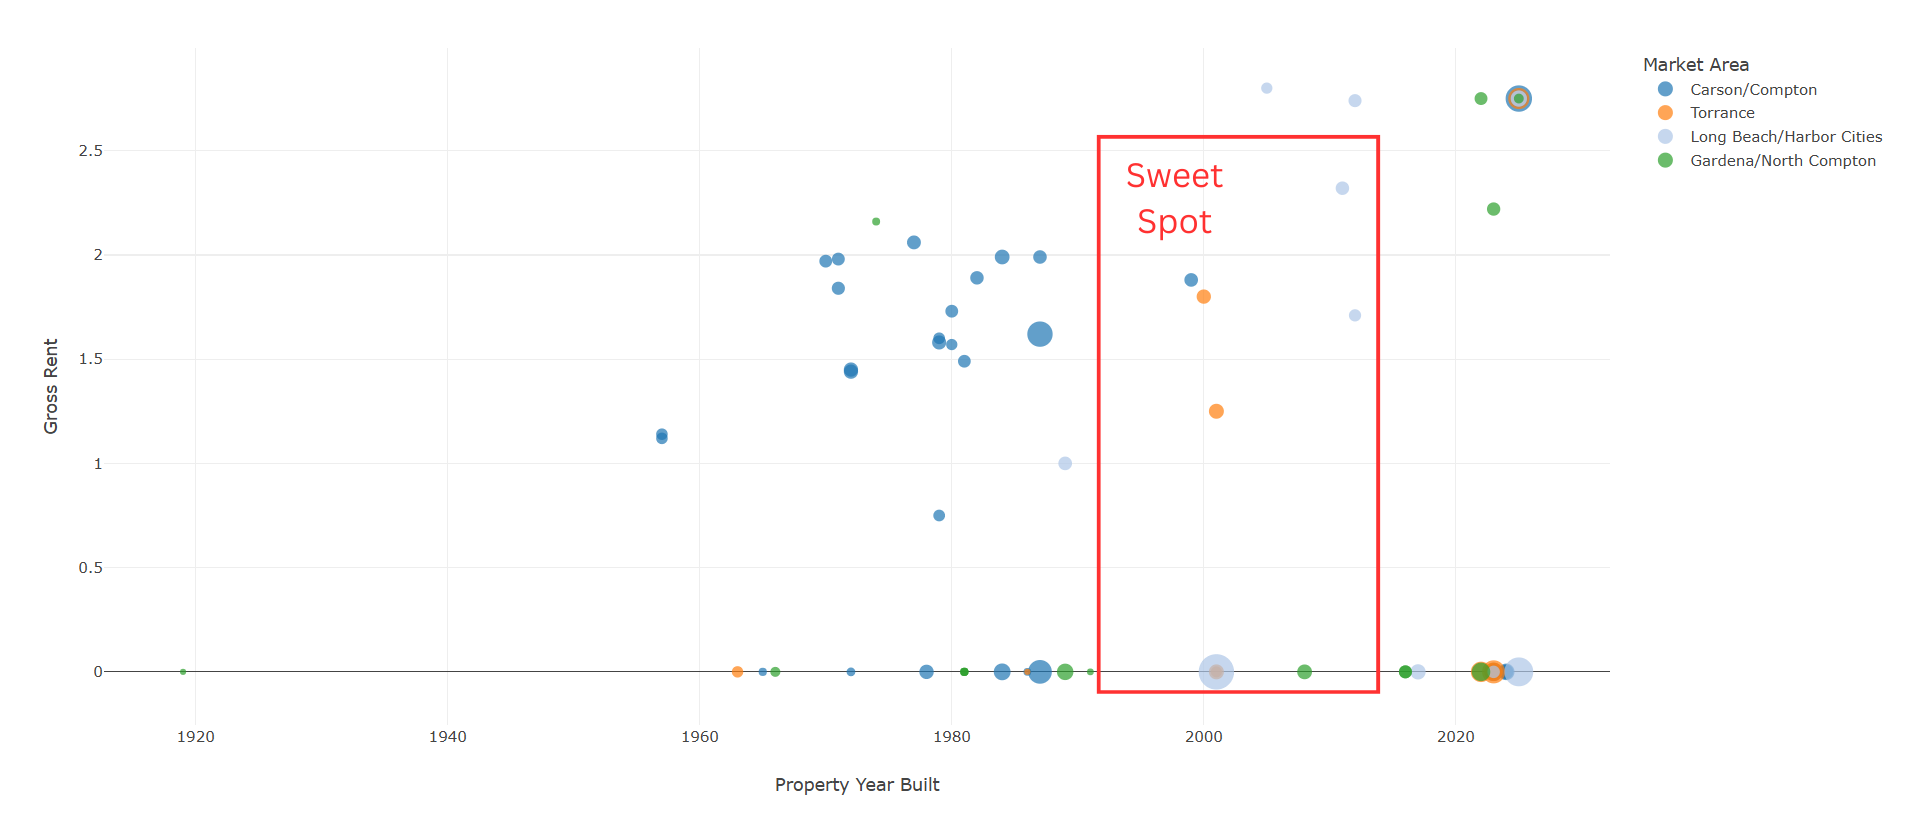
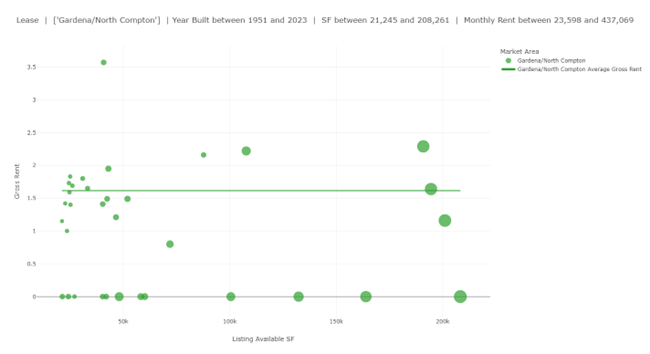
For most tenants, better values are found in second or third generation buildings. This means buildings that are roughly 15 to 20 years old having already been occupied by previous tenants. They are still modern warehouses with good ceiling heights (24’-30’), loading, power, and efficient layouts. Most of these second generation buildings are well away from residential areas which have become a greater concern for industrial users. Many are LEED certified.
Newer buildings are even more functional because of higher ceilings (32’-40’) and better design. They are more costly because of higher land prices, construction costs, and property taxes. Most are unpriced and appear on the bottom of the graph. In reality, they should be on the top scale because they are the most expensive. Older buildings (pre-2000) can require upgrades to overhead sprinklers, seismic, offices, and have design flaws that can inhibit efficient operations.
The number of offerings in the current cycle will give you a wide selection of choices in almost all Southern California markets.
Current Rent-(Gross)
75,000 SF – 150,000 SF
All South Bay
By Year Built
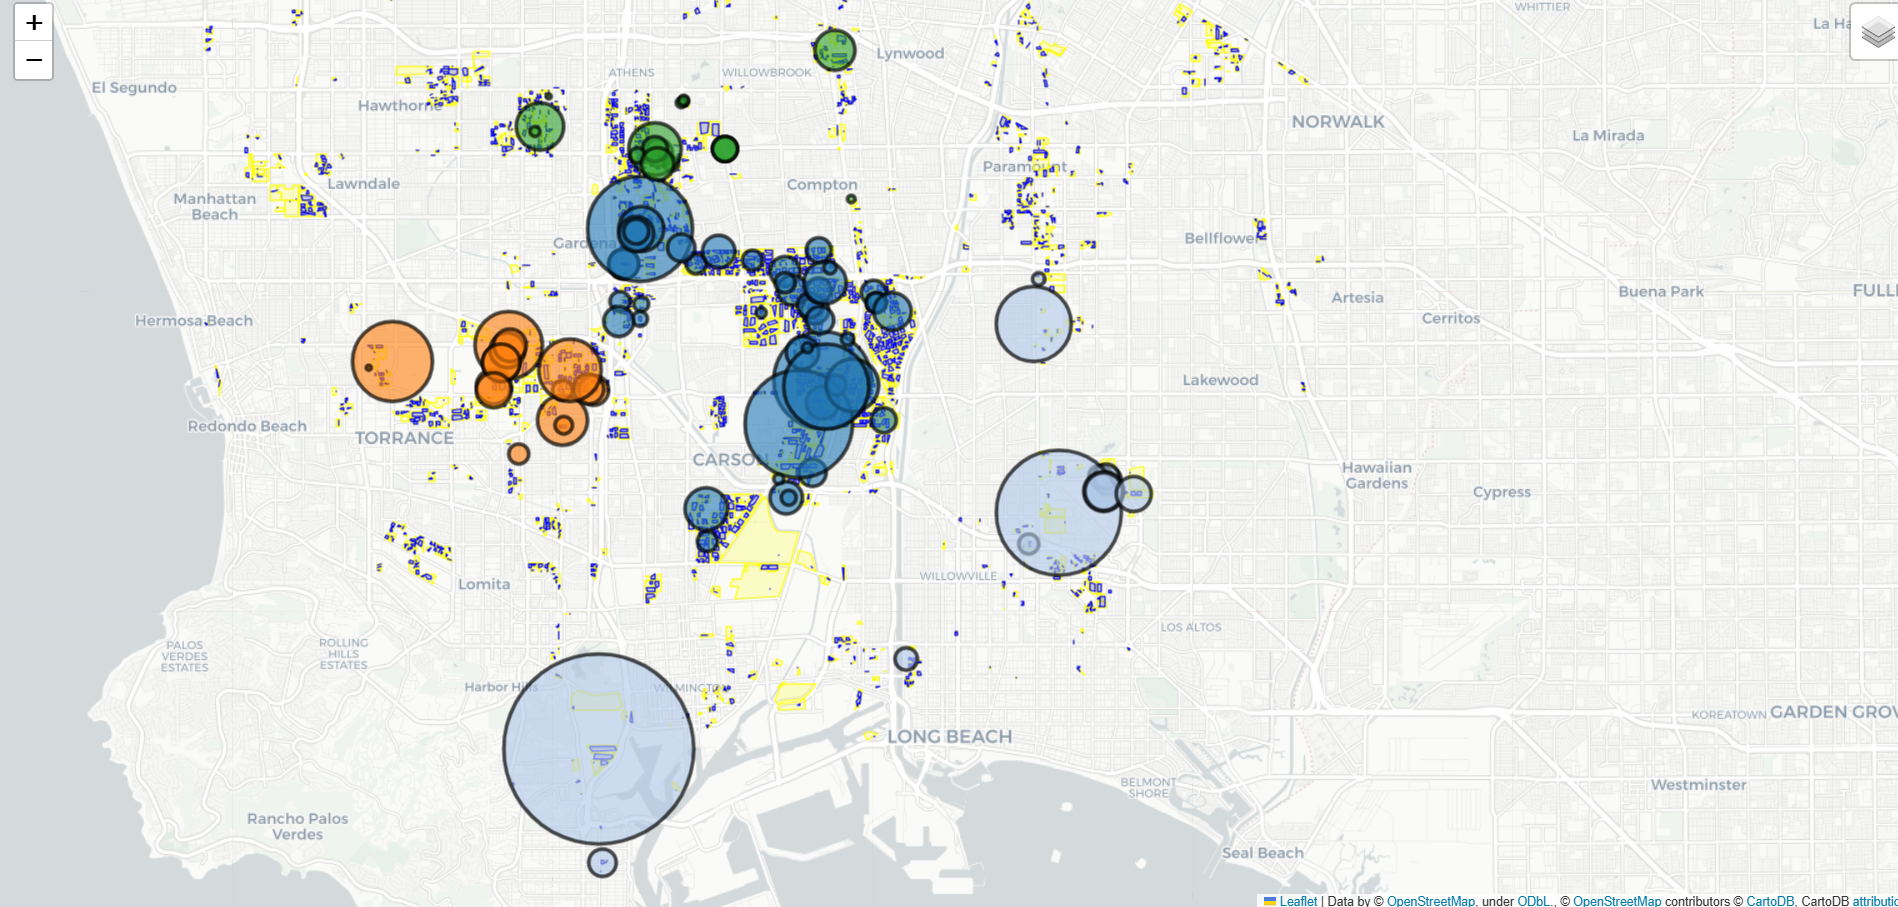
Location Map
Please Contact: Jim Klein, SIOR – 310-451-8121 – jimklein@kleincom.com
1204 W. Gardena Blvd, #A, Gardena, CA 90248

WE SELL INDUSTRIAL BUILDINGS
Current Rent-(Include Property Taxes and Insurance)
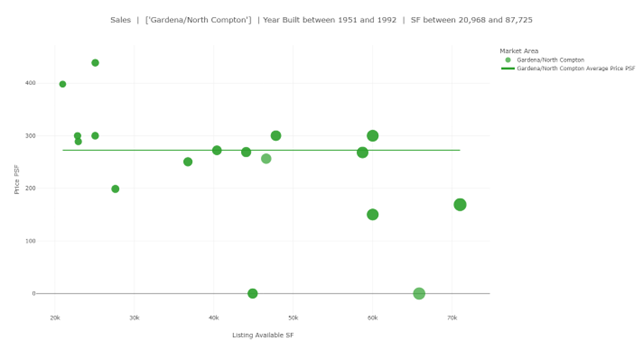
Current Sale Prices
Location Map
Please Contact: Jim Klein, SIOR-310-451-8121-jimklein@kleincom.com
1204 W. Gardena Blvd, #A, Gardena, CA 90248

Making More Industrial Real Estate Deals with AI – SIOR Hollywood – October 15-17, 2024
- Using AI to support your business.
- Building applications for representation and to locate deals.
- Web Scraping.
- You will generally need support in areas of AI, Cloud, Database, Web, data processing and coding languages like Python.
- You can find very good tech support at local community colleges and data science degree programs.
- AI takes time and investment.
- Good Sources include Ethan Mollick for a comprehensive overview and Topher Stephenson for CRE specific.
EXAMPLE:
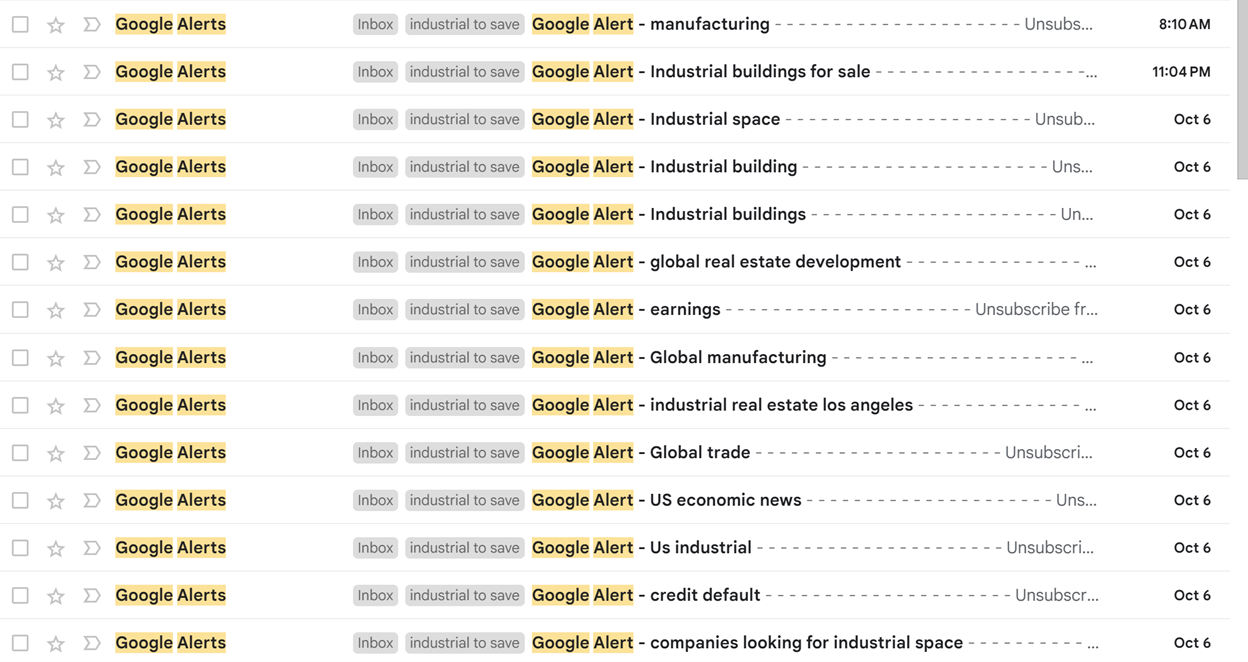
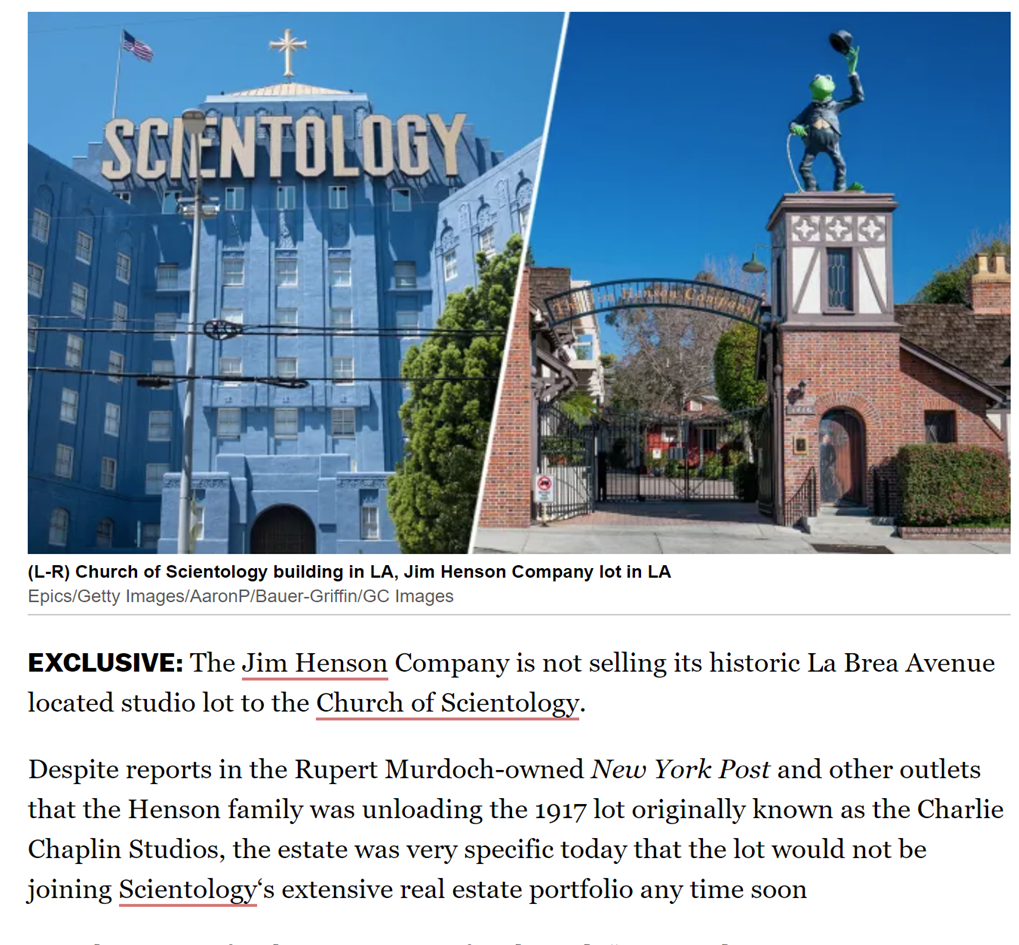
We use Google Alerts to find leads:
ChatGPT Response:
The Jim Henson Company Lot, where the Jim Henson Studios are located, is at:
1416 N La Brea Ave, Hollywood, CA 90028, USA
This historic lot has been home to the studios since 2000, when The Jim Henson Company purchased the site.
ChatGPT Response:
The area around 1416 N La Brea Ave in Hollywood, CA, is a bustling section of Los Angeles with numerous property developers and owners involved in both commercial and residential real estate. Some of the largest and most prominent property developers and real estate owners in the Hollywood area include:
1. **Hudson Pacific Properties**: Known for its significant presence in Hollywood, especially with properties like the Sunset Bronson Studios and other office developments.
2. **Kilroy Realty Corporation**: Has been involved in several development projects, including office and mixed-use spaces in the Hollywood area.
3. **CIM Group**: A major player in urban development, CIM has several properties in Hollywood and throughout Los Angeles, known for developing mixed-use residential and commercial spaces.
4. **Crescent Heights**: A prominent developer known for high-end residential and mixed-use projects, including some developments in the Hollywood vicinity.
5. **Related Companies**: A leading real estate firm with projects across Los Angeles,
————————————————————————————————————-
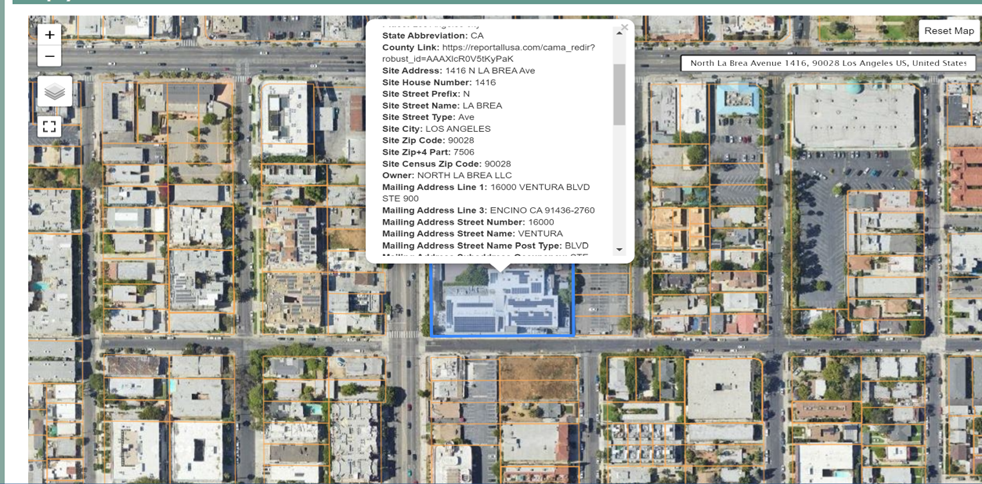
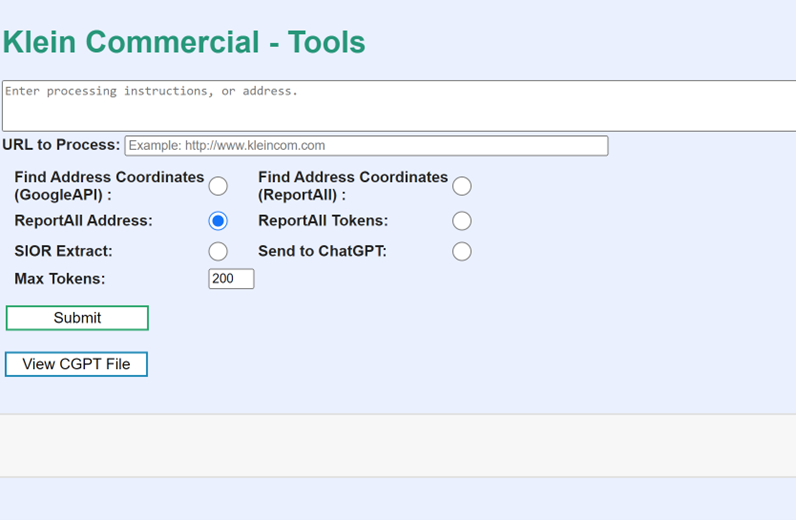
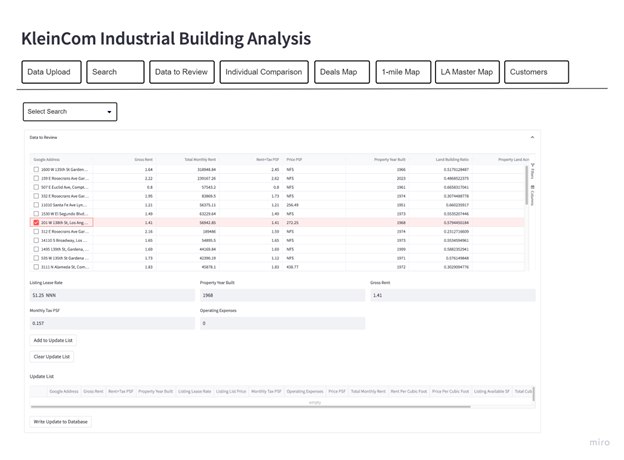
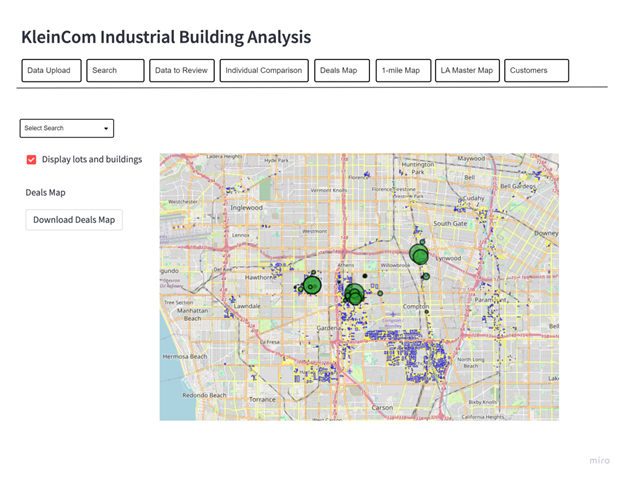
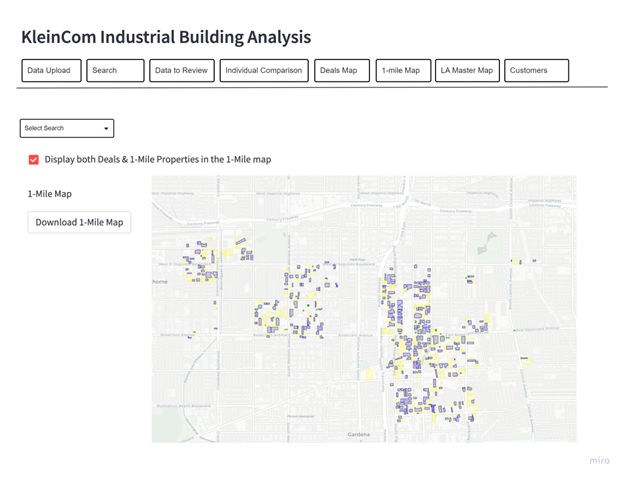
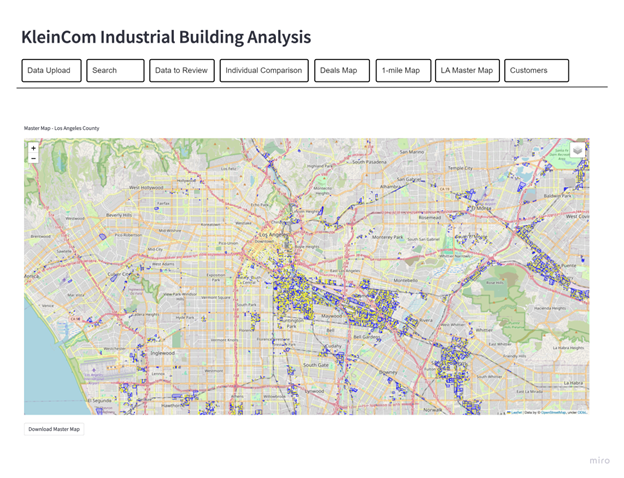
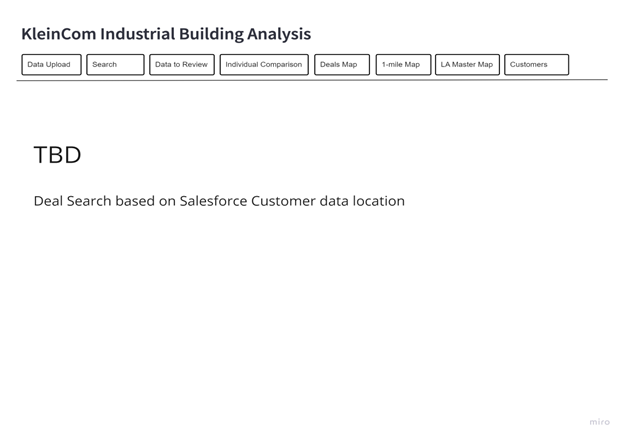
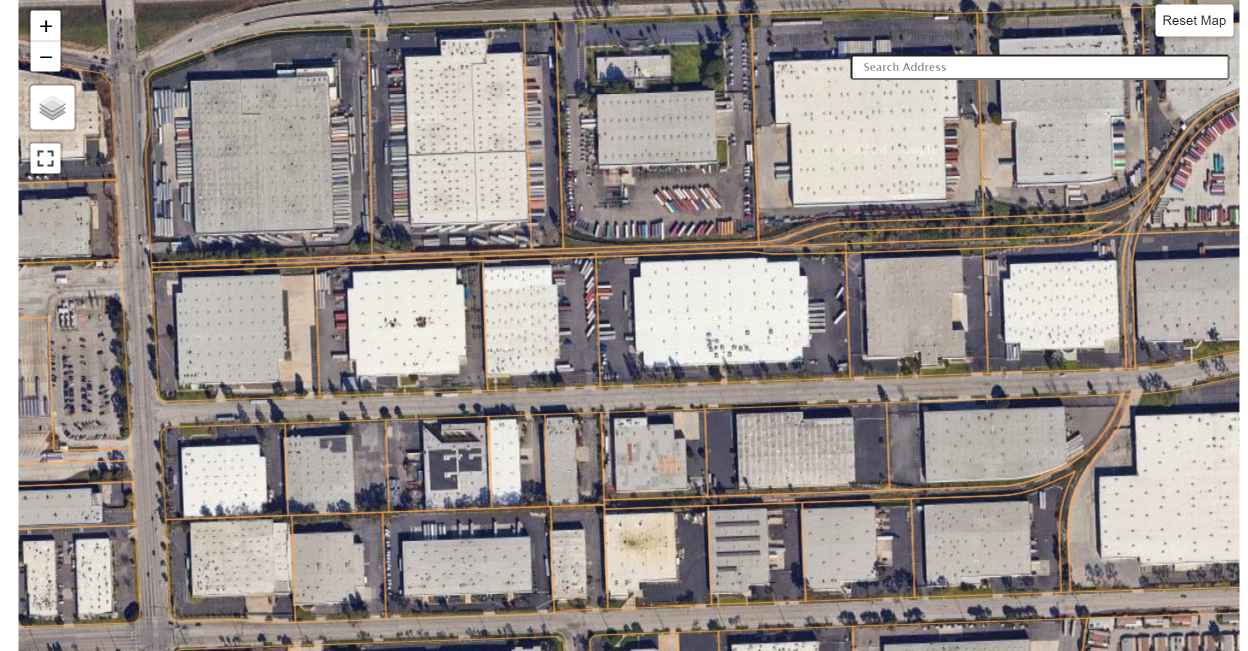
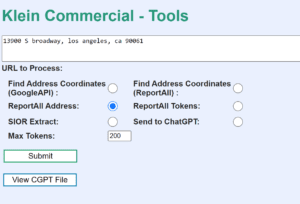
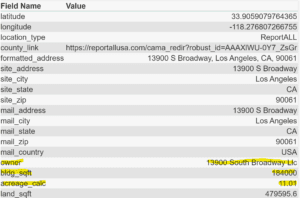
Developing our own tool for using both internet and our own private data. It’s connected to several of our own data sources and ChatGPT. If we see something interesting, we can search for information, find ownership data for the property, and bring up a parcel map.
EXAMPLE:
Finds Owners:
EXAMPLE:
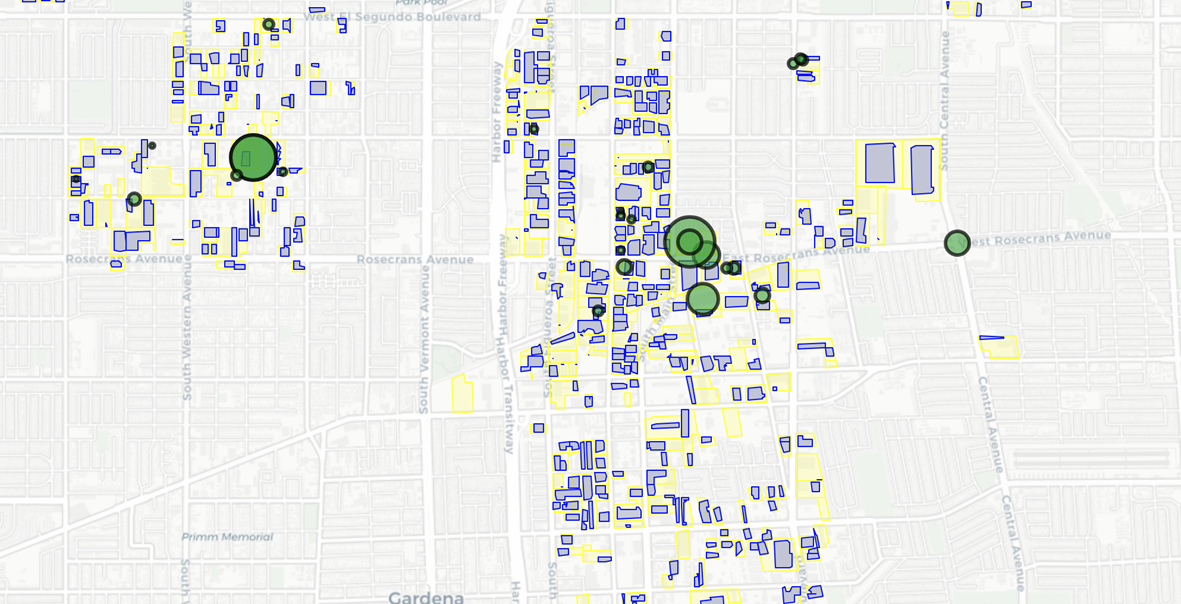
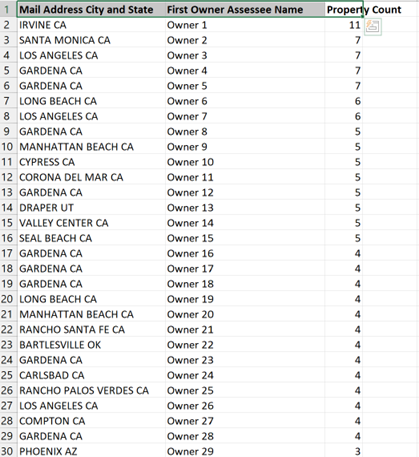
Internal Data. Who owns the most properties in Gardena?
We uploaded our parcel data to ChatGPT for answers: (Actual Owner name removed for privacy)
Proximity
Using Lat and Long, what are the 3 closest available properties to the corner Broadway and Rosecrans in Los Angeles? In this case it could not read the spreadsheet but it did read the data when we pasted it into the program. It returned the following:
ChatGPT Response:
Here are the approximate distances from the intersection of Broadway and Rosecrans in Gardena, CA to the three specified properties, converted to miles:
- 159 E Rosecrans Ave, Gardena, CA 90248, USA
- Distance: Approximately 0.43 miles east of the intersection.
- 312 E Rosecrans Ave, Gardena, CA 90248, USA
- Distance: Approximately 0.53 miles east of the intersection.
- 332 E Rosecrans Ave, Gardena, CA 90248, USA
- Distance: Approximately 0.56 miles east of the intersection
EXAMPLE:
I need addresses for all Independent industrial SIORS so I can send my postcards but all I had was their name, email, company name, and city – No mailing address. I submitted my list through out Chat GPT App, and it returned all mailing addresses.
—————————————————————————————————-
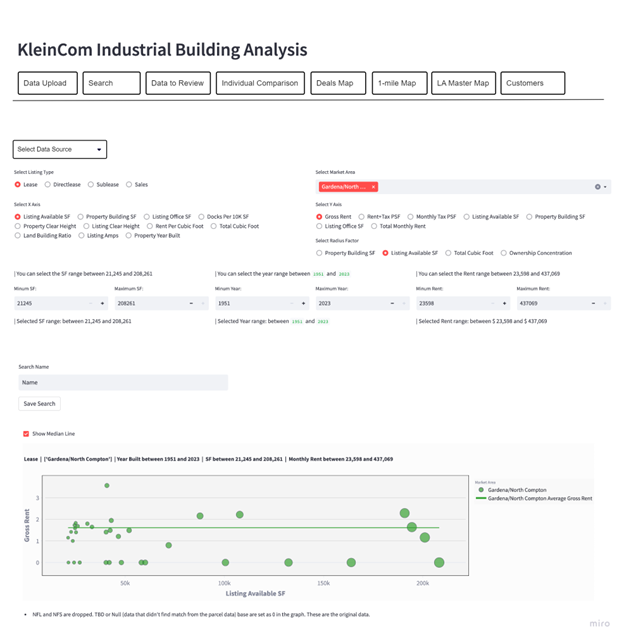
MAPPING:
PARCEL MAPPING:

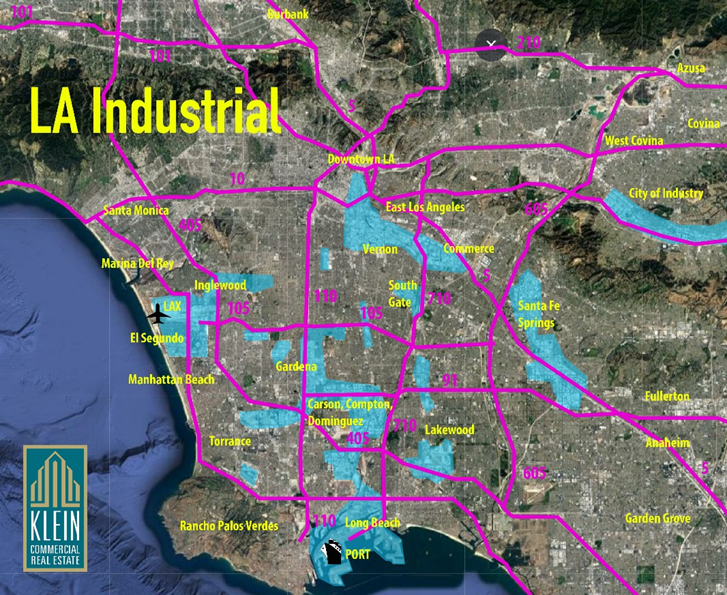
Los Angeles Industrial Real Estate Report (with a focus on Gardena)
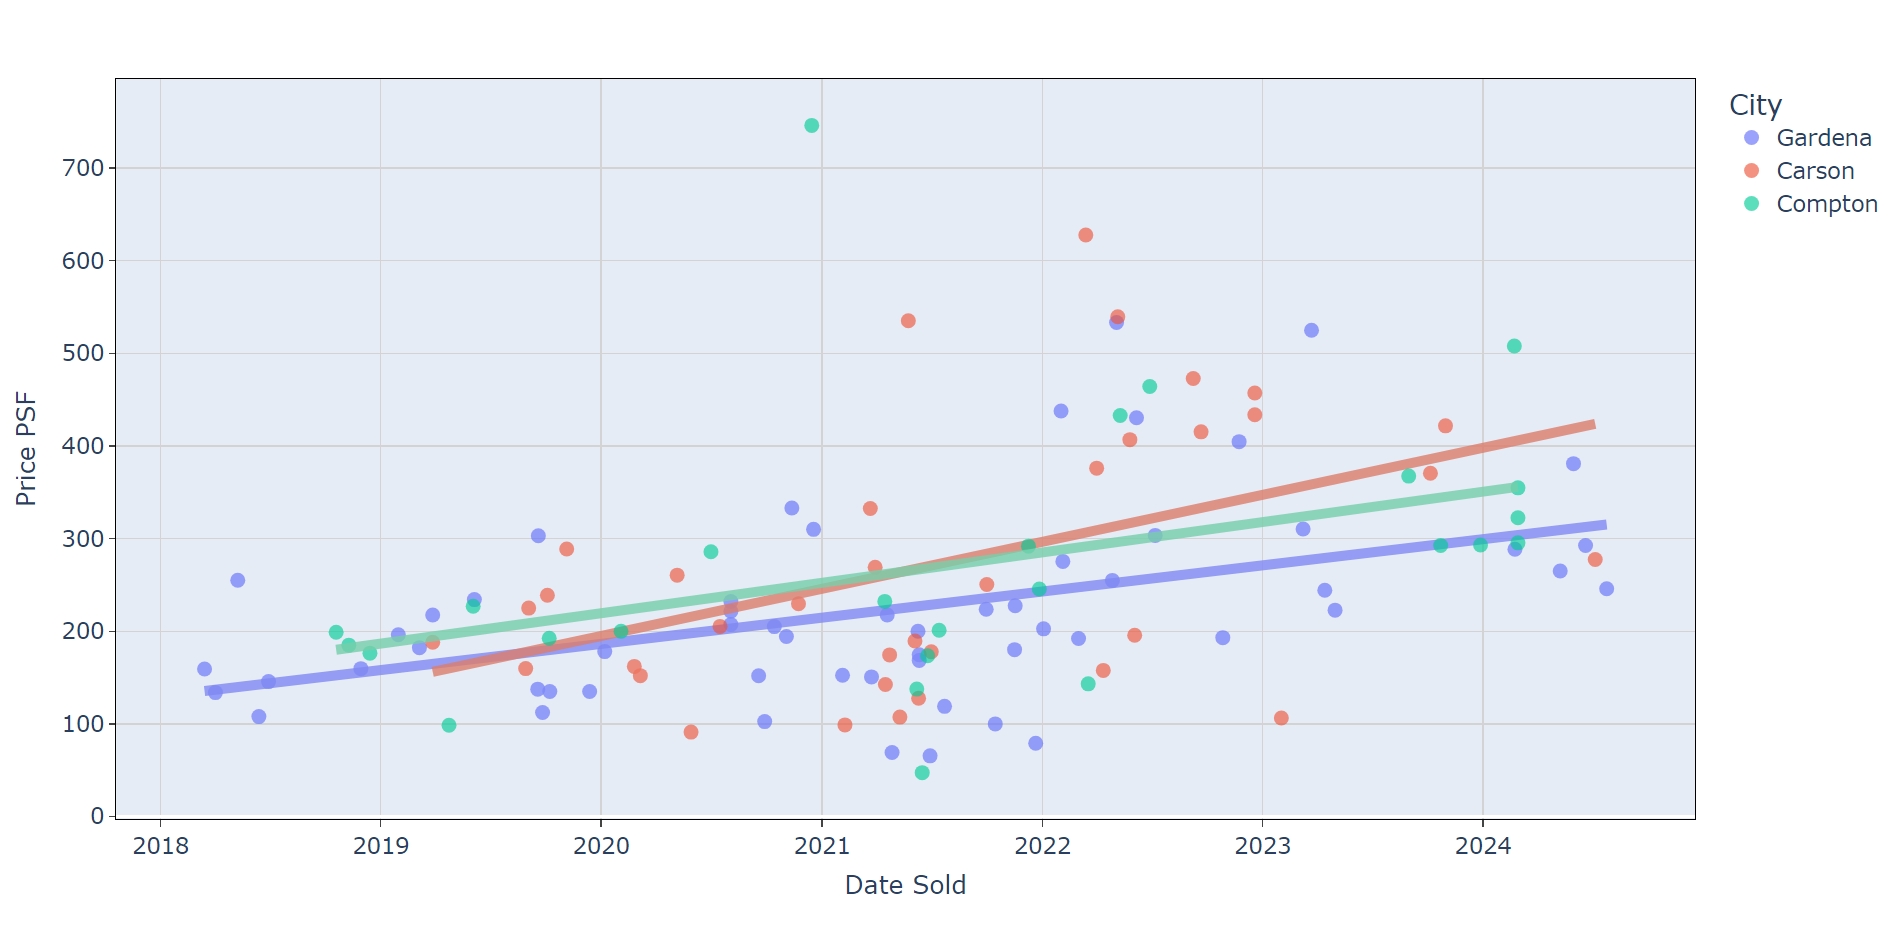
Leasing conditions throughout Los Angeles have moderated from the rent surges of the Covid period. Nowhere felt the impact from the Supply Chain Crisis more acutely than San Pedro Bay. There were severe space shortages and warehouse rents were increasing daily. The frenzy was magnified by extremely low interest rates that brought a host of investors to purchase sub-institutional grade property and land developments.
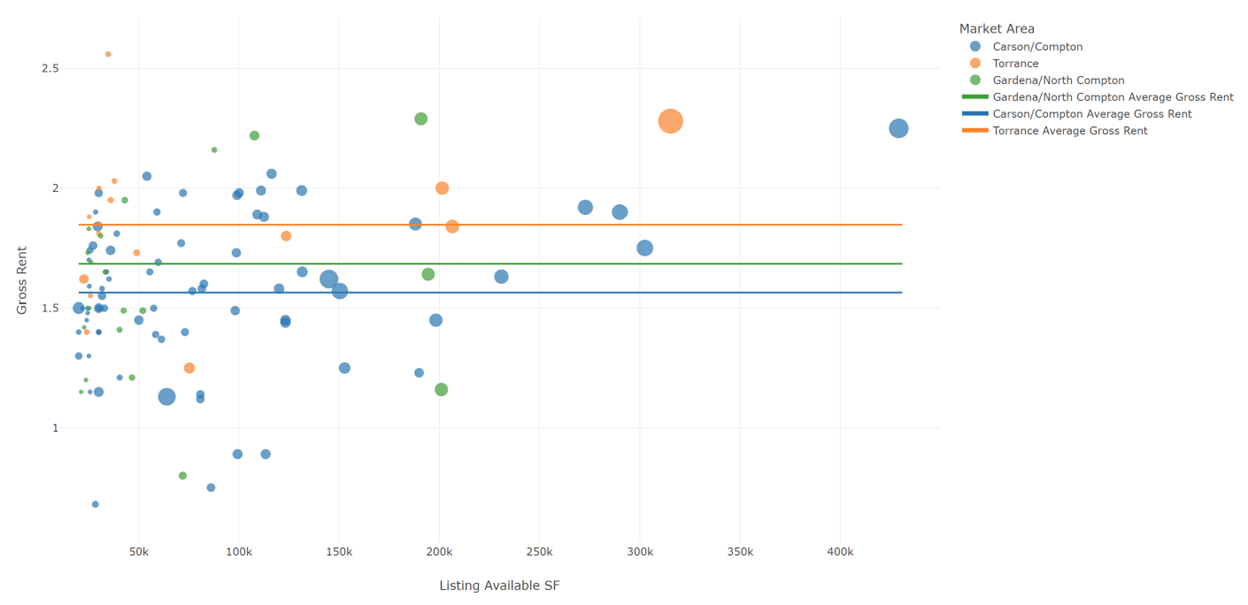
A mix of price moderation and higher interest rates rate starting in early 2023 brought a cooling to market conditions and we are now in a normally functioning market that favors the tenant. While rents are down from the peak, they are steady on a long-term basis. There is good supply in the South Bay area. You can find reasonable space at $1.50 per foot Gross (including taxes and property insurance). Newer buildings are priced in the range of $2.50 per foot (all-in).Property taxes, due to Prop 13, have an outsized effect on the rent.
Not only has the market normalized, meaning rents have come down, but development activity created a bifurcation between two tiers of space. One is the older tier, with lower rents, smaller footprints, partial obsolescence, and suitable for local tenants. The new tier is “development space” recently completed with superior attributes, large footprints, built for regional sized companies or national freight distributors. The pricing difference between the two tiers is 60%, coincidentally, the same difference between 32’ high and 20’ high. Development spaces, while located in Gardena, are not necessarily intended for organically growing Gardena companies but for larger companies comparing the entire L.A. Basin.
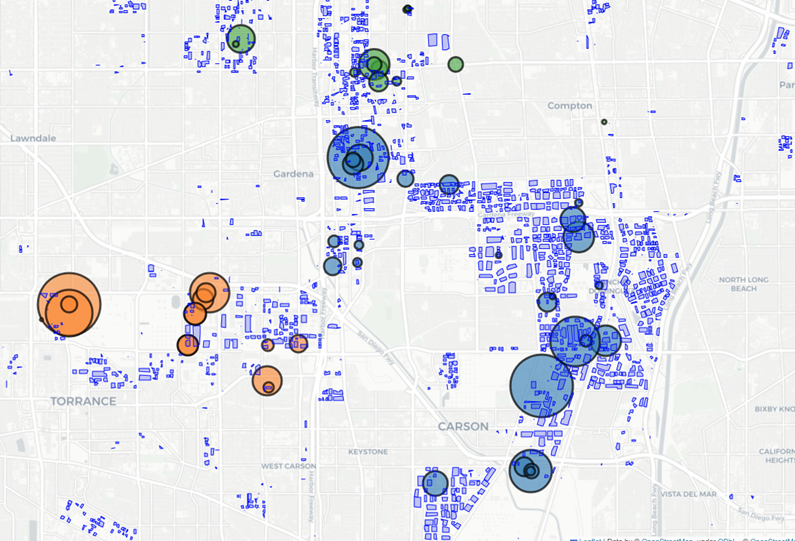
While current supply is plentiful, the rift between residents and industrial uses will result in a long-term restriction of industrial buildings. Local moratoriums, zoning prohibitions, and statewide measures like California Assembly Bill 98, (Planning and zoning: logistics use: truck routes), enshrines a 500’ and in other cases, a 900’ buffer from “sensitive receptors”. Inother words, intensive industrial need to be away from schools, residences, churches,medical facilities and other places with a high concentration of people.
While Green Zone ordinances in LA County are meant to satisfy residents, it doesn’t address the underlying issues of crime, unsanitary conditions, trash, and homelessness. If the County were to listen to businesses, they would attract better companies and property owners wouldn’t have to solely rely on truckers and warehousers to lease their properties. Green zones and similar restrictions are the result of neglect by County leaders desperate to appease residents without having to do the hard work of making these neighborhoods safe and livable.
*******************************************************************************************
The opportunity in Los Angeles industrial real estate is as great now as ever because activity is constant.
Los Angeles a premier industrial market in the United States. While interest rates, trade flows, taxes and governmental policies will alter your tactics, there are three consistent dynamics which keep deals flowing.
1. Real estate is local. This principle of the property business states the most interested buyers and tenants are closest to the property in ever widening circles. Social Scientists and Urban Geographers call it agglomeration and Los Angeles has a very high ratio of local commercial interaction. When businesses grow, they want to maintain proximity to markets, customers, and employees and will often decide to stay close.
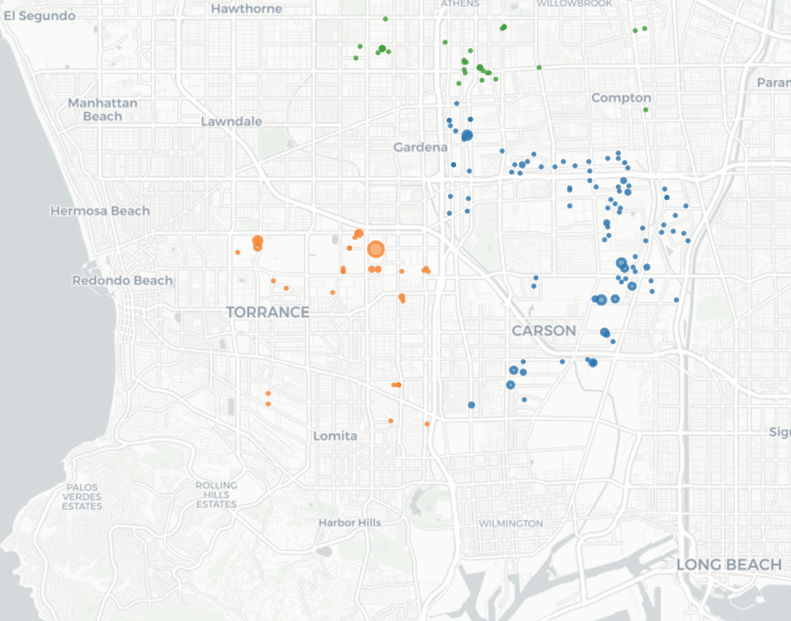
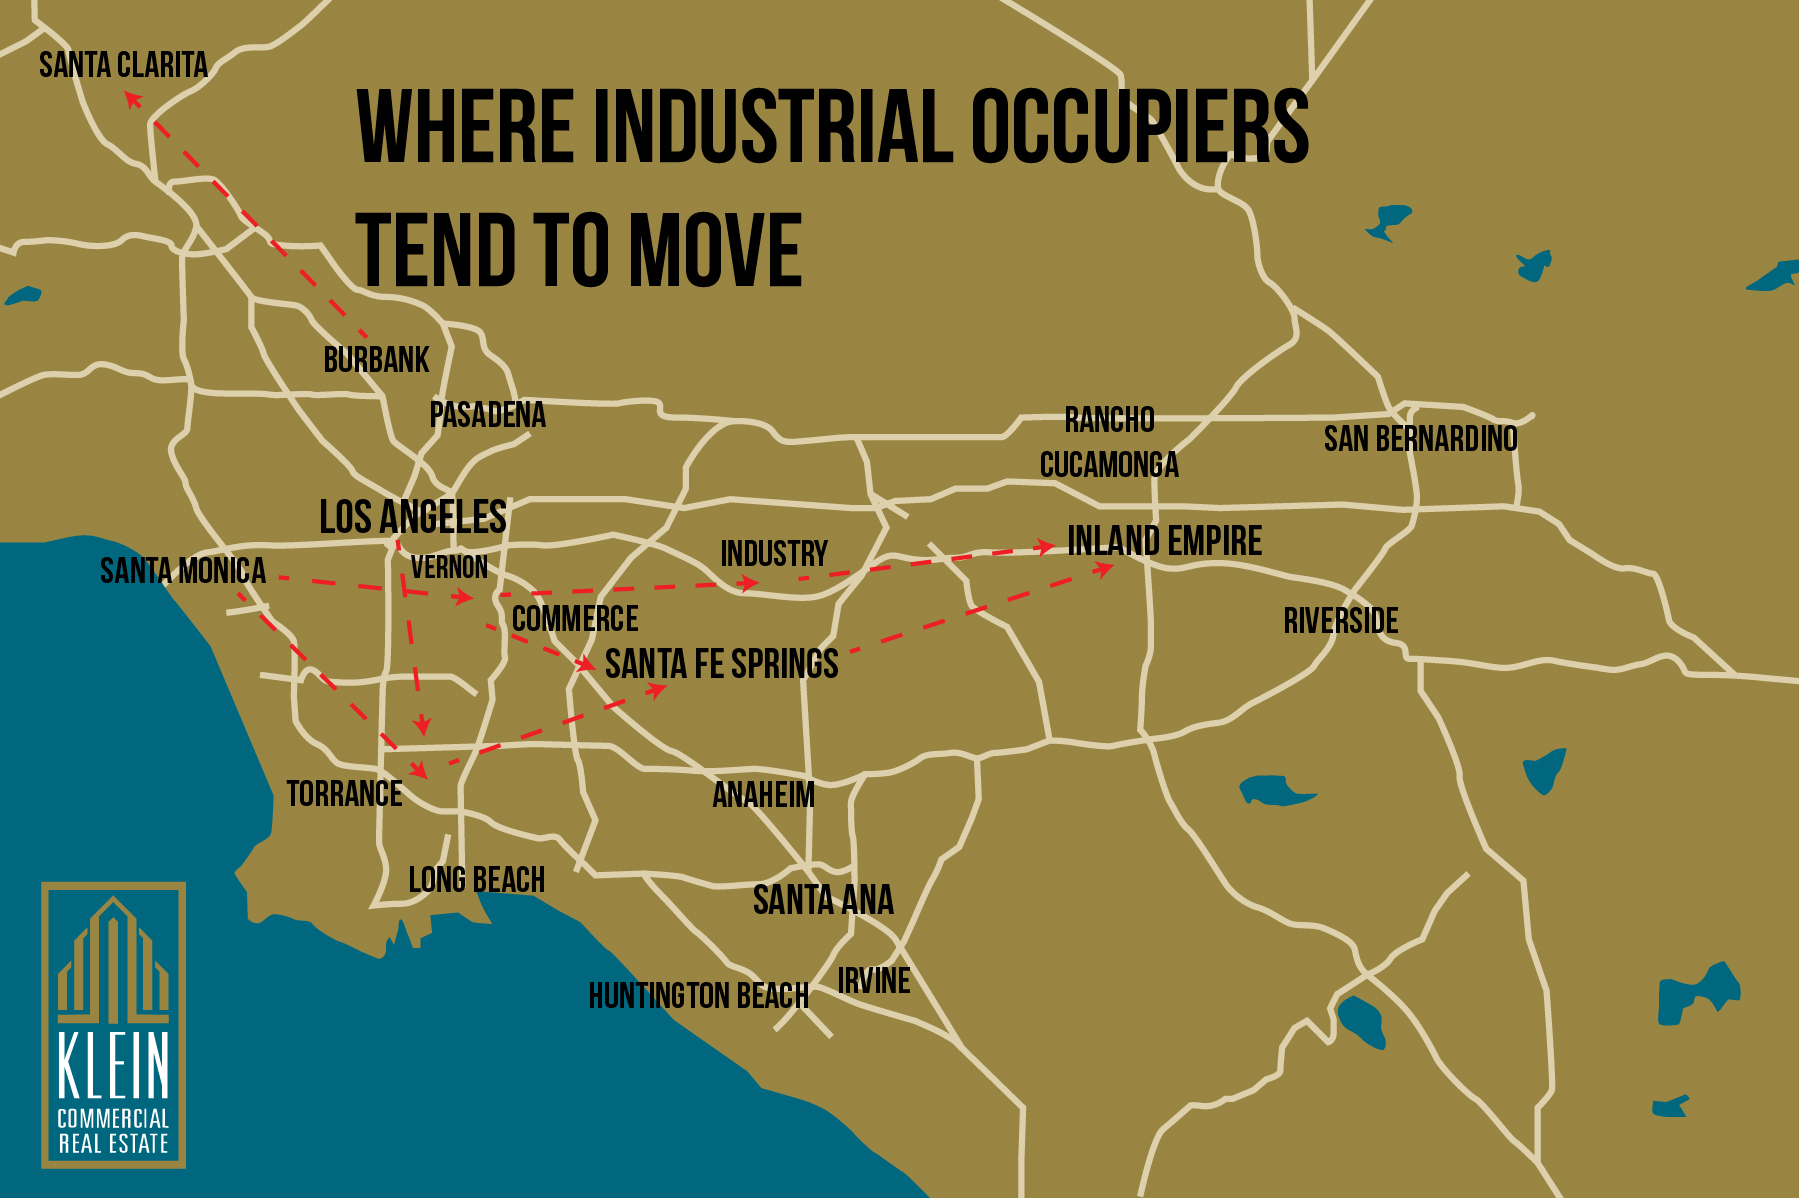
2. It’s possible to anticipate where companies are moving from based on historical trends. Companies generally move for more space, less rent and to improve their business.Companies in L. A. County generally follow the same movement patterns, mostly based on the freeway network. As an example, West L.A. companies will move south down the 405 Freeway. South Bay Companies will move to Mid Counties (91 Freeway). Mid Counties will move to the Inland Empire (10 , 60 and 91). There are many other patterns in Southern California that keeps company movement local and predictable. Anticipating where tenants come from keep buildings leased.
4. Aside from geography, there is always robust transactional activity among investors. Except in rare instances of turbulence, properties flow from private hands to investor control. It’s a steady force as new capital follows an old business plan of finding buildings that will provide a reasonable return to their investors. Los Angeles is a crossroads destination with a lot of property still residing in private hands. In addition, Owner/Users will buy when the mortgage payment is equivalent to rent. It’s a positive time to purchase.
****************************************************************************************************
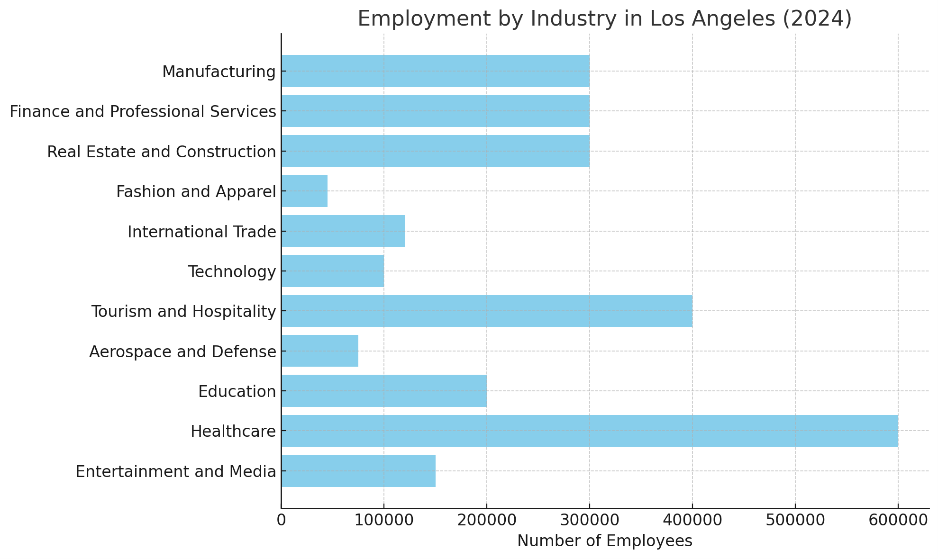
What makes Southern California an industrial powerhouse? Within a 60-minute drive of Downtown Los Angeles, there is approximately 2 Billion square feet of industrial space worth $500 Billion dollars and is almost 15% of the entire industrial space in the U.S.
Most people arrive at LAX which is the largest employment center of aerospace and defense employment in the U.S. SpaceX, TRW, Lockheed Martin, Northrop, BAE, and Raytheon have major facilities along with their suppliers and subcontractors. As a derivative of its engineering and technical resources , El Segundo has a burgeoning “Hard Tech” industry that combines digital technology and physical manufacturing.
Thirty minutes south on the 405 Freeway are the Ports of Long Beach and Los Angeles. Each by themselves has more container volume than any other US port and when combined creates a shipping colossus that supports local warehouses and trade from the South Bay, to Downtown, Mid Counties, Inland Empire and as far as Phoenix and Las Vegas. Approximately 4 million rail cars head to other parts of the U.S. from the six intermodal railyards in the region.
Heading north on the Long Beach Freeway (710), in thirty minutes, you reach Downtown Los Angeles, particularly Commerce and Vernon. These cities were the manufacturing center of the West with large production plants that built cars, tires, glass, food, plastics, furniture and clothing. While many of the largest plants are gone, it left a robust industrial infrastructure with approximately 4,000 companies and 100,000 employees. Today, food, apparel, furniture, metals, machinery and the second largest U.S. wholesale market are major businesses.
Another 20 minutes northeast on the 101 Freeway, you reach Hollywood, home to the international capital of film, television, recording, pre-and-post production employing 200,000 (down from 250,000 at its peak in 2017).
Heading east is the San Gabriel Valley and Inland Empire with 1 Billion square feet of industrial buildings. To the Southeast towards Orange County is Mid Counties. And north is the San Fernando Valley. Each of these submarkets have more industrial space by themselves than most U.S. metros.
Klein Commercial Real Estate has been locally headquartered in Gardena for 45 years. Our specialty is selling industrial buildings and representing corporations in their real estate moves.

Gardena Industrial Building Report – Video


