# Updated Analysis: Hard Tech Manufacturing Demand in South Bay Los Angeles
## Executive Summary
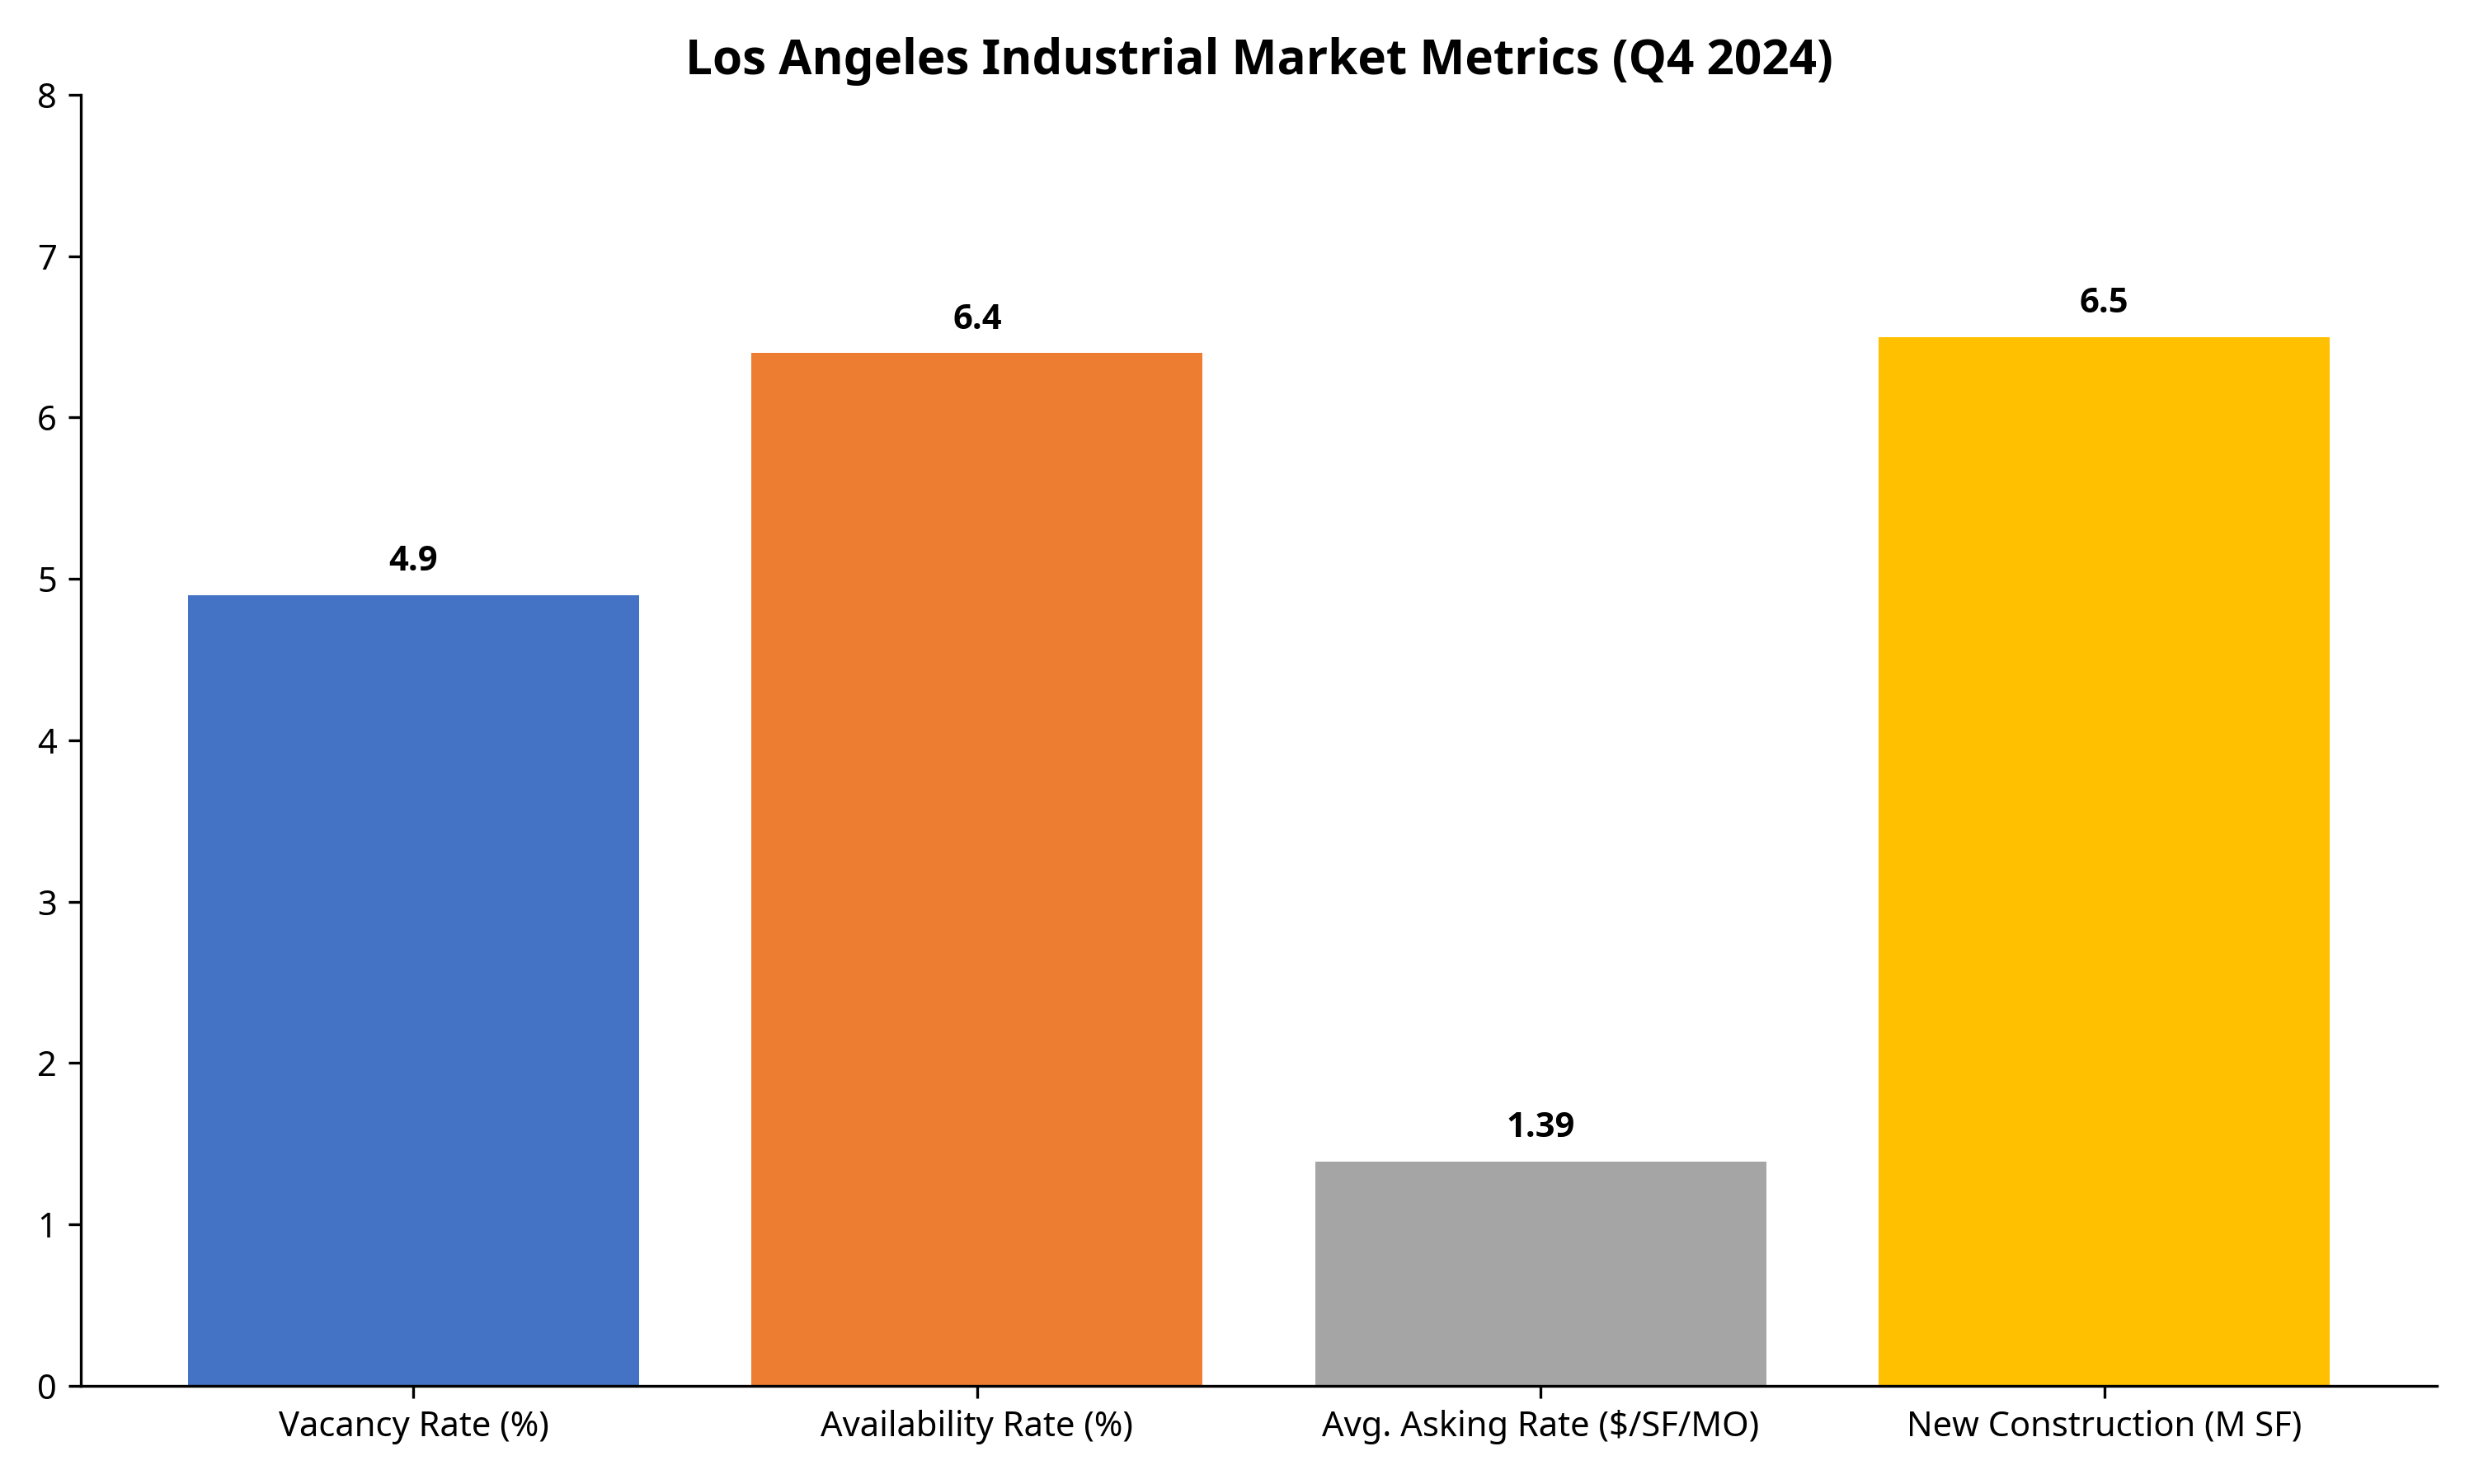
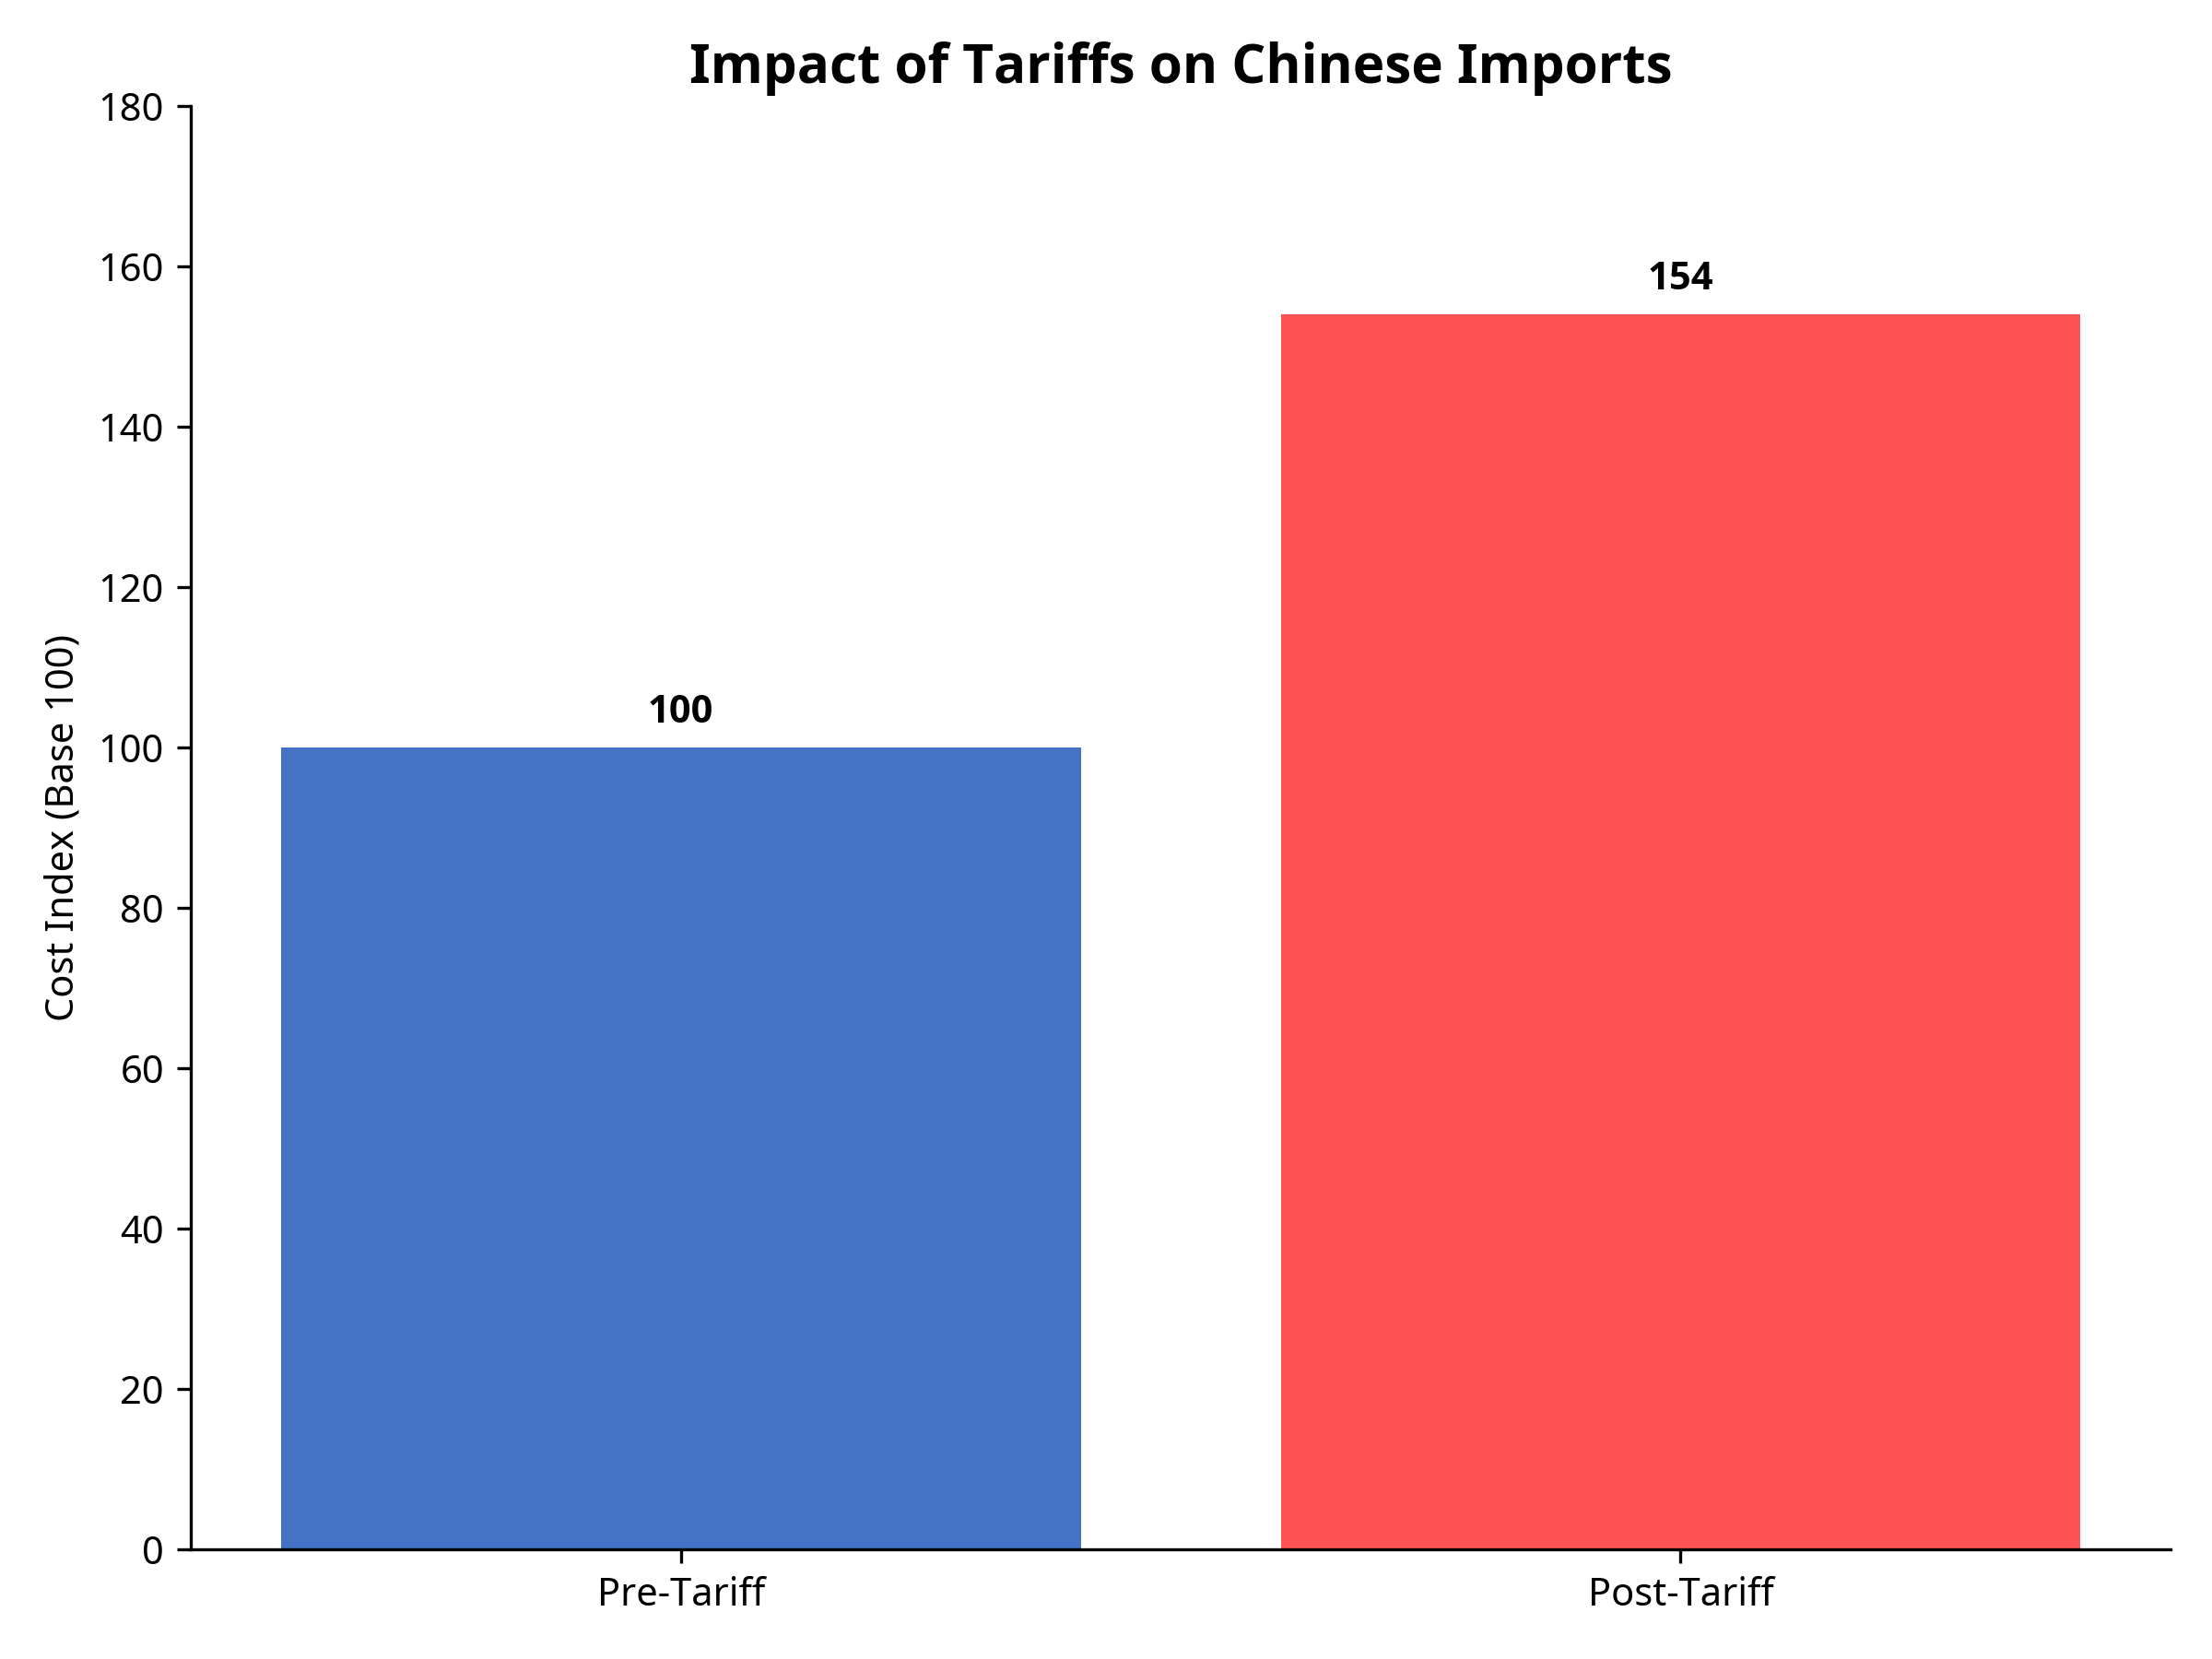
Based on new market insights and research, this analysis updates our previous report on Los Angeles industrial real estate opportunities in the tariff era. A significant mismatch exists between current industrial real estate supply (optimized for warehouse/distribution) and actual market demand (increasingly from aerospace, defense, and space manufacturing). This creates both challenges and unique investment opportunities, particularly in the South Bay market where hard tech manufacturing is experiencing substantial growth.
## Key Findings
1. **Supply-Demand Mismatch**: Recent industrial developments were primarily designed for warehouse and distribution with numerous dock doors and container yards, but current demand is predominantly from manufacturing sectors.
2. **Hard Tech Growth in South Bay**: The South Bay region has emerged as “ground zero” for hard tech manufacturing, driven by aerospace, defense, and space technology companies.
3. **SpaceX Effect**: SpaceX’s presence has created a powerful talent ecosystem and entrepreneurial engine, with its alumni network founding over 96 companies that have collectively raised more than $19 billion.
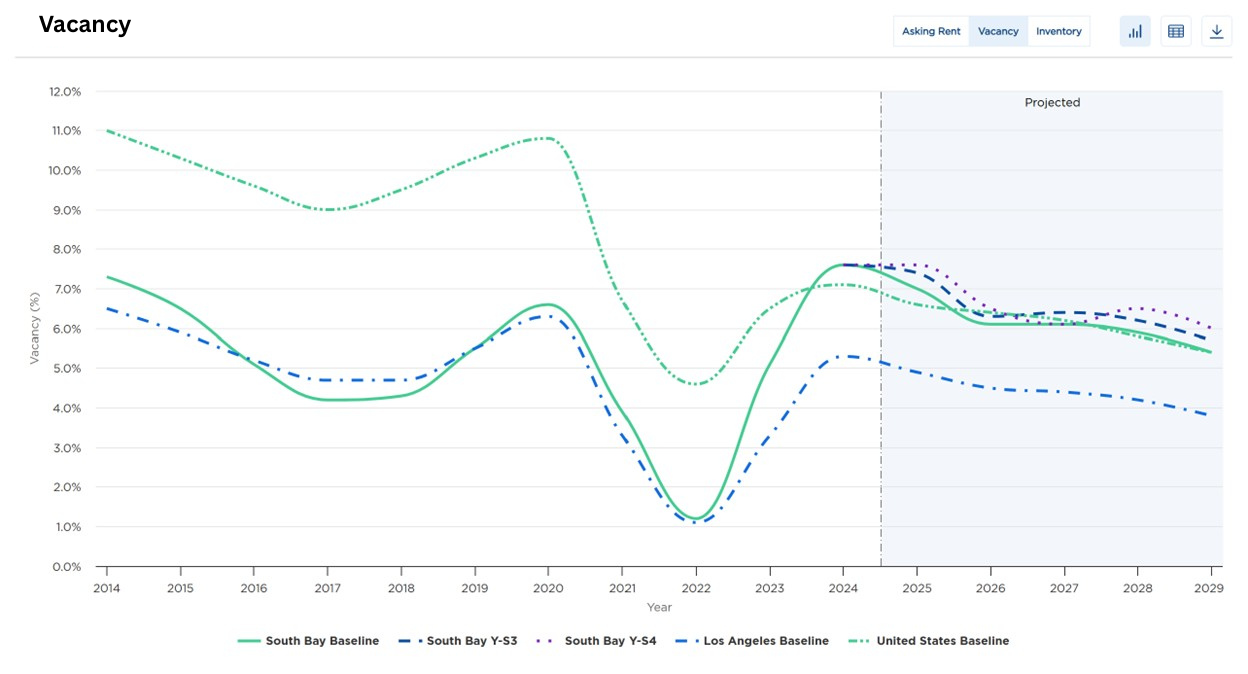
4. **Increasing Manufacturing Footprints**: Despite overall market vacancy increases, hard tech companies are actively expanding their manufacturing space in South Bay, as evidenced by Trio Manufacturing tripling its footprint and Aerospacelab establishing a new 35,000 sq ft manufacturing facility.
5. **Specialized Talent Concentration**: South Bay hosts a unique concentration of specialized engineering talent that is difficult to find elsewhere, creating a self-reinforcing ecosystem for hard tech growth.
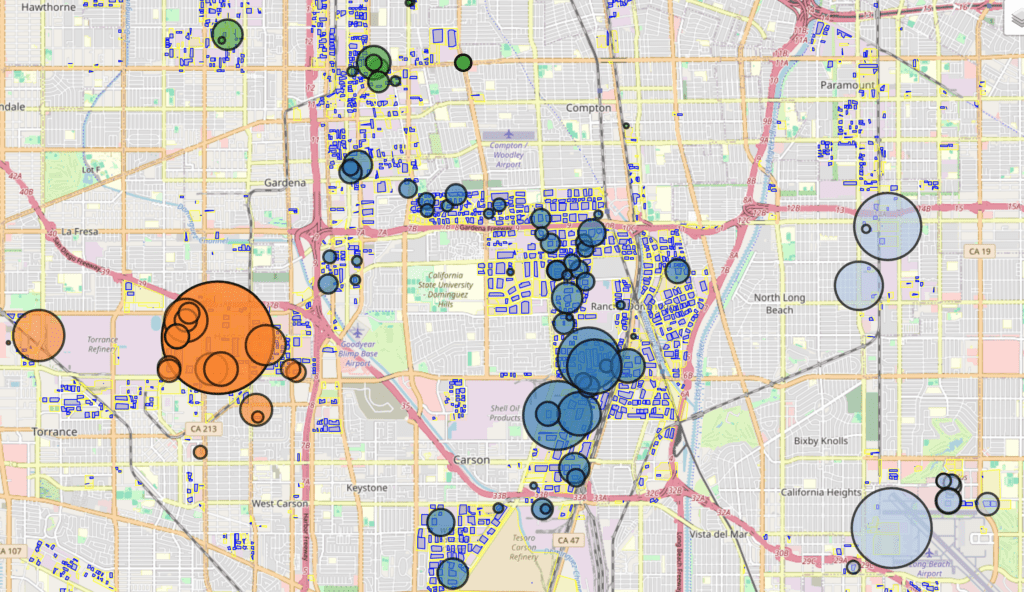
## South Bay Hard Tech Demand Assessment
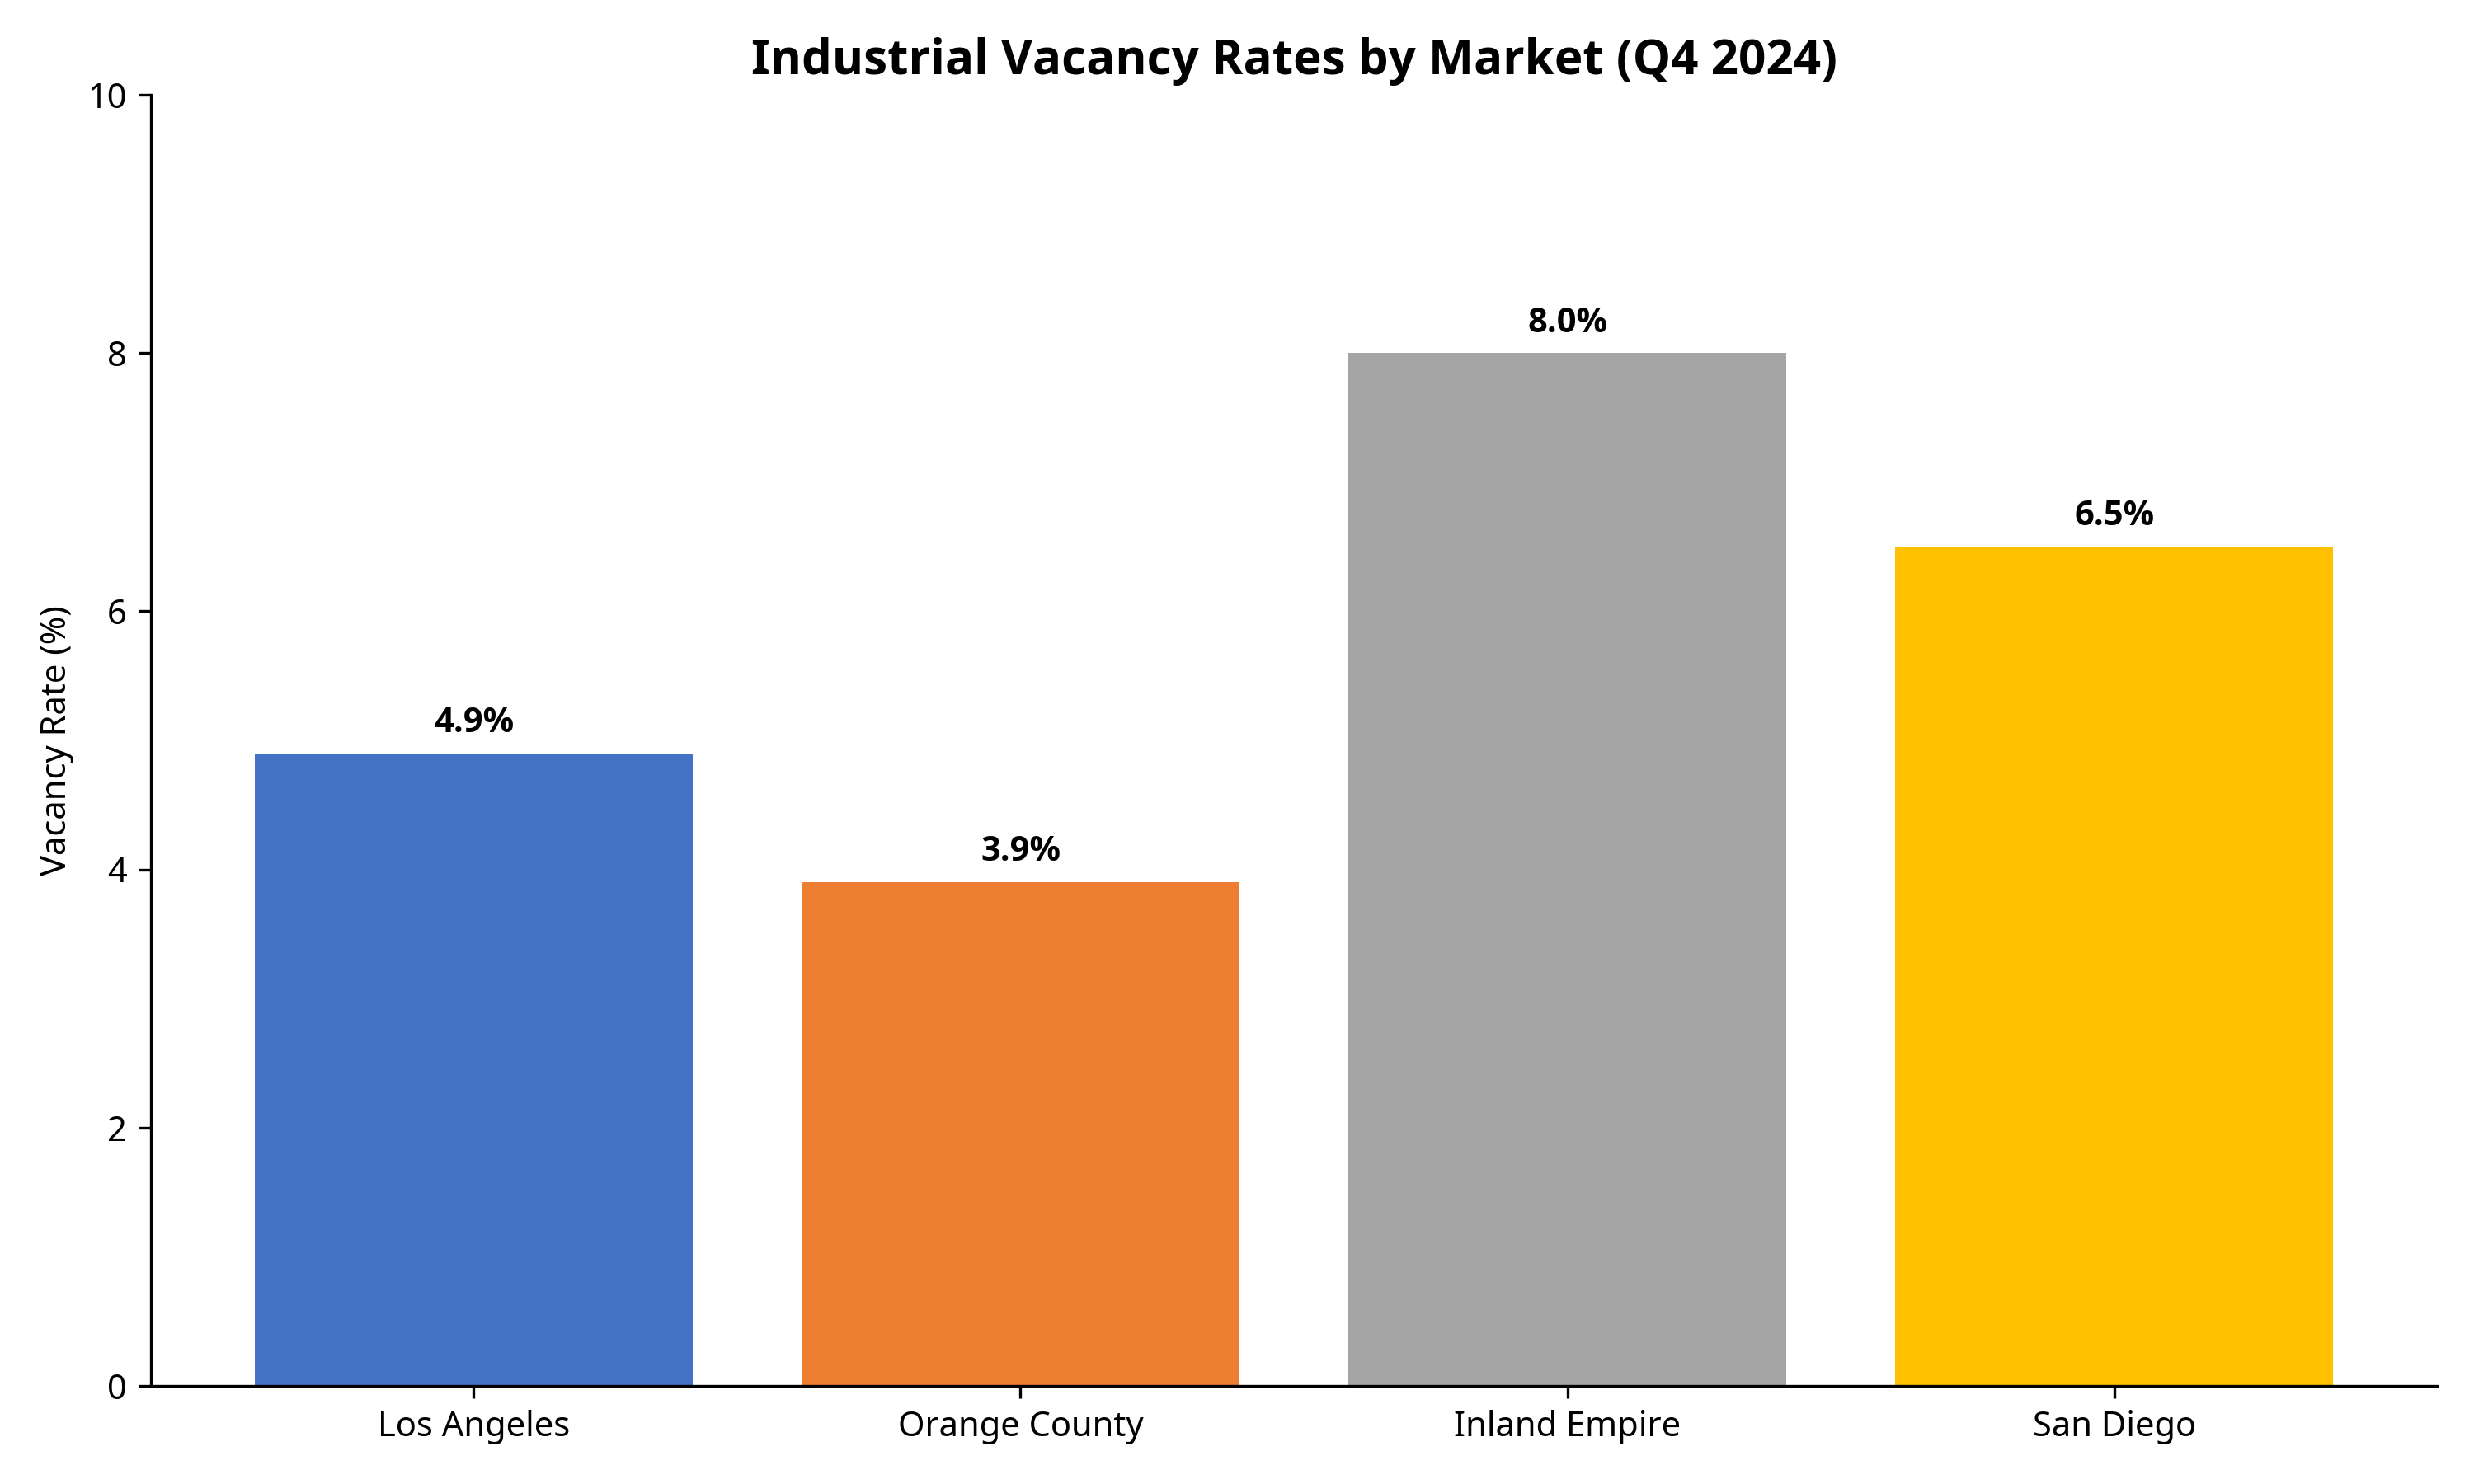
The South Bay region of Los Angeles has transformed from what was once dismissively called “the sticks” into the epicenter of hard tech innovation in Southern California. This transformation is particularly notable given the broader context of increasing industrial vacancy rates across the region.
### Current State of Hard Tech in South Bay
1. **Concentration of Companies**: Of the LA Hard Tech 50 companies covering all of Southern California, thirty are located in South Bay, including fourteen in the five and a half square mile city limits of El Segundo.
2. **Talent Ecosystem**: South Bay is attracting a unique culture of young Gen Z and Millennial founders in hard tech who are leveraging decades of experience from more seasoned engineers working in established engineering firms.
3. **Manufacturing Focus**: These companies are focused on rapid iteration, agile hardware design, and prototyping using new tools from the local hard tech ecosystem, including additive manufacturing of metal and specialized software tools.
4. **Growth Trajectory**: Demand for manufacturing space in the South Bay continues to rise as new startups in aerospace, defense, and hard tech emerge and capitalize on the rich labor pool in the market.
### Specific Examples of Hard Tech Expansion
1. **Aerospacelab**: Recently opened a 35,000-square-foot satellite manufacturing facility and U.S. headquarters in Torrance, with plans to double their local workforce by the end of the year.
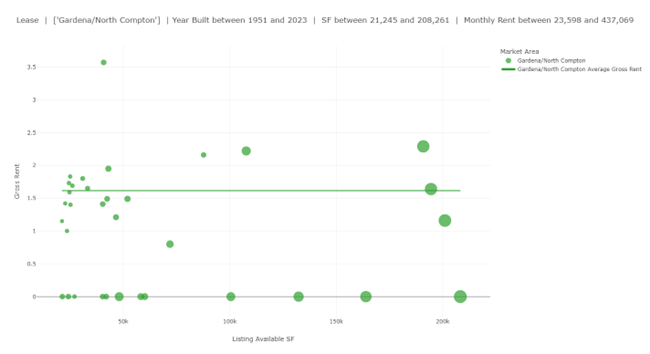
2. **Trio Manufacturing**: An aircraft engineering and manufacturing firm specializing in both commercial and military endeavors has tripled its footprint, relocating from a 40,076-square-foot facility in El Segundo to a 123,189-square-foot building near Gardena and Carson.
3. **SpaceX Alumni Network**: The SpaceX talent ecosystem has grown from twenty engineers in 2004 to over 10,000 employees today, representing over 1% of South Bay’s population of 750,000 people.
## Structural Challenges in the Market
The mismatch between supply and demand presents several structural challenges that create both problems and opportunities:
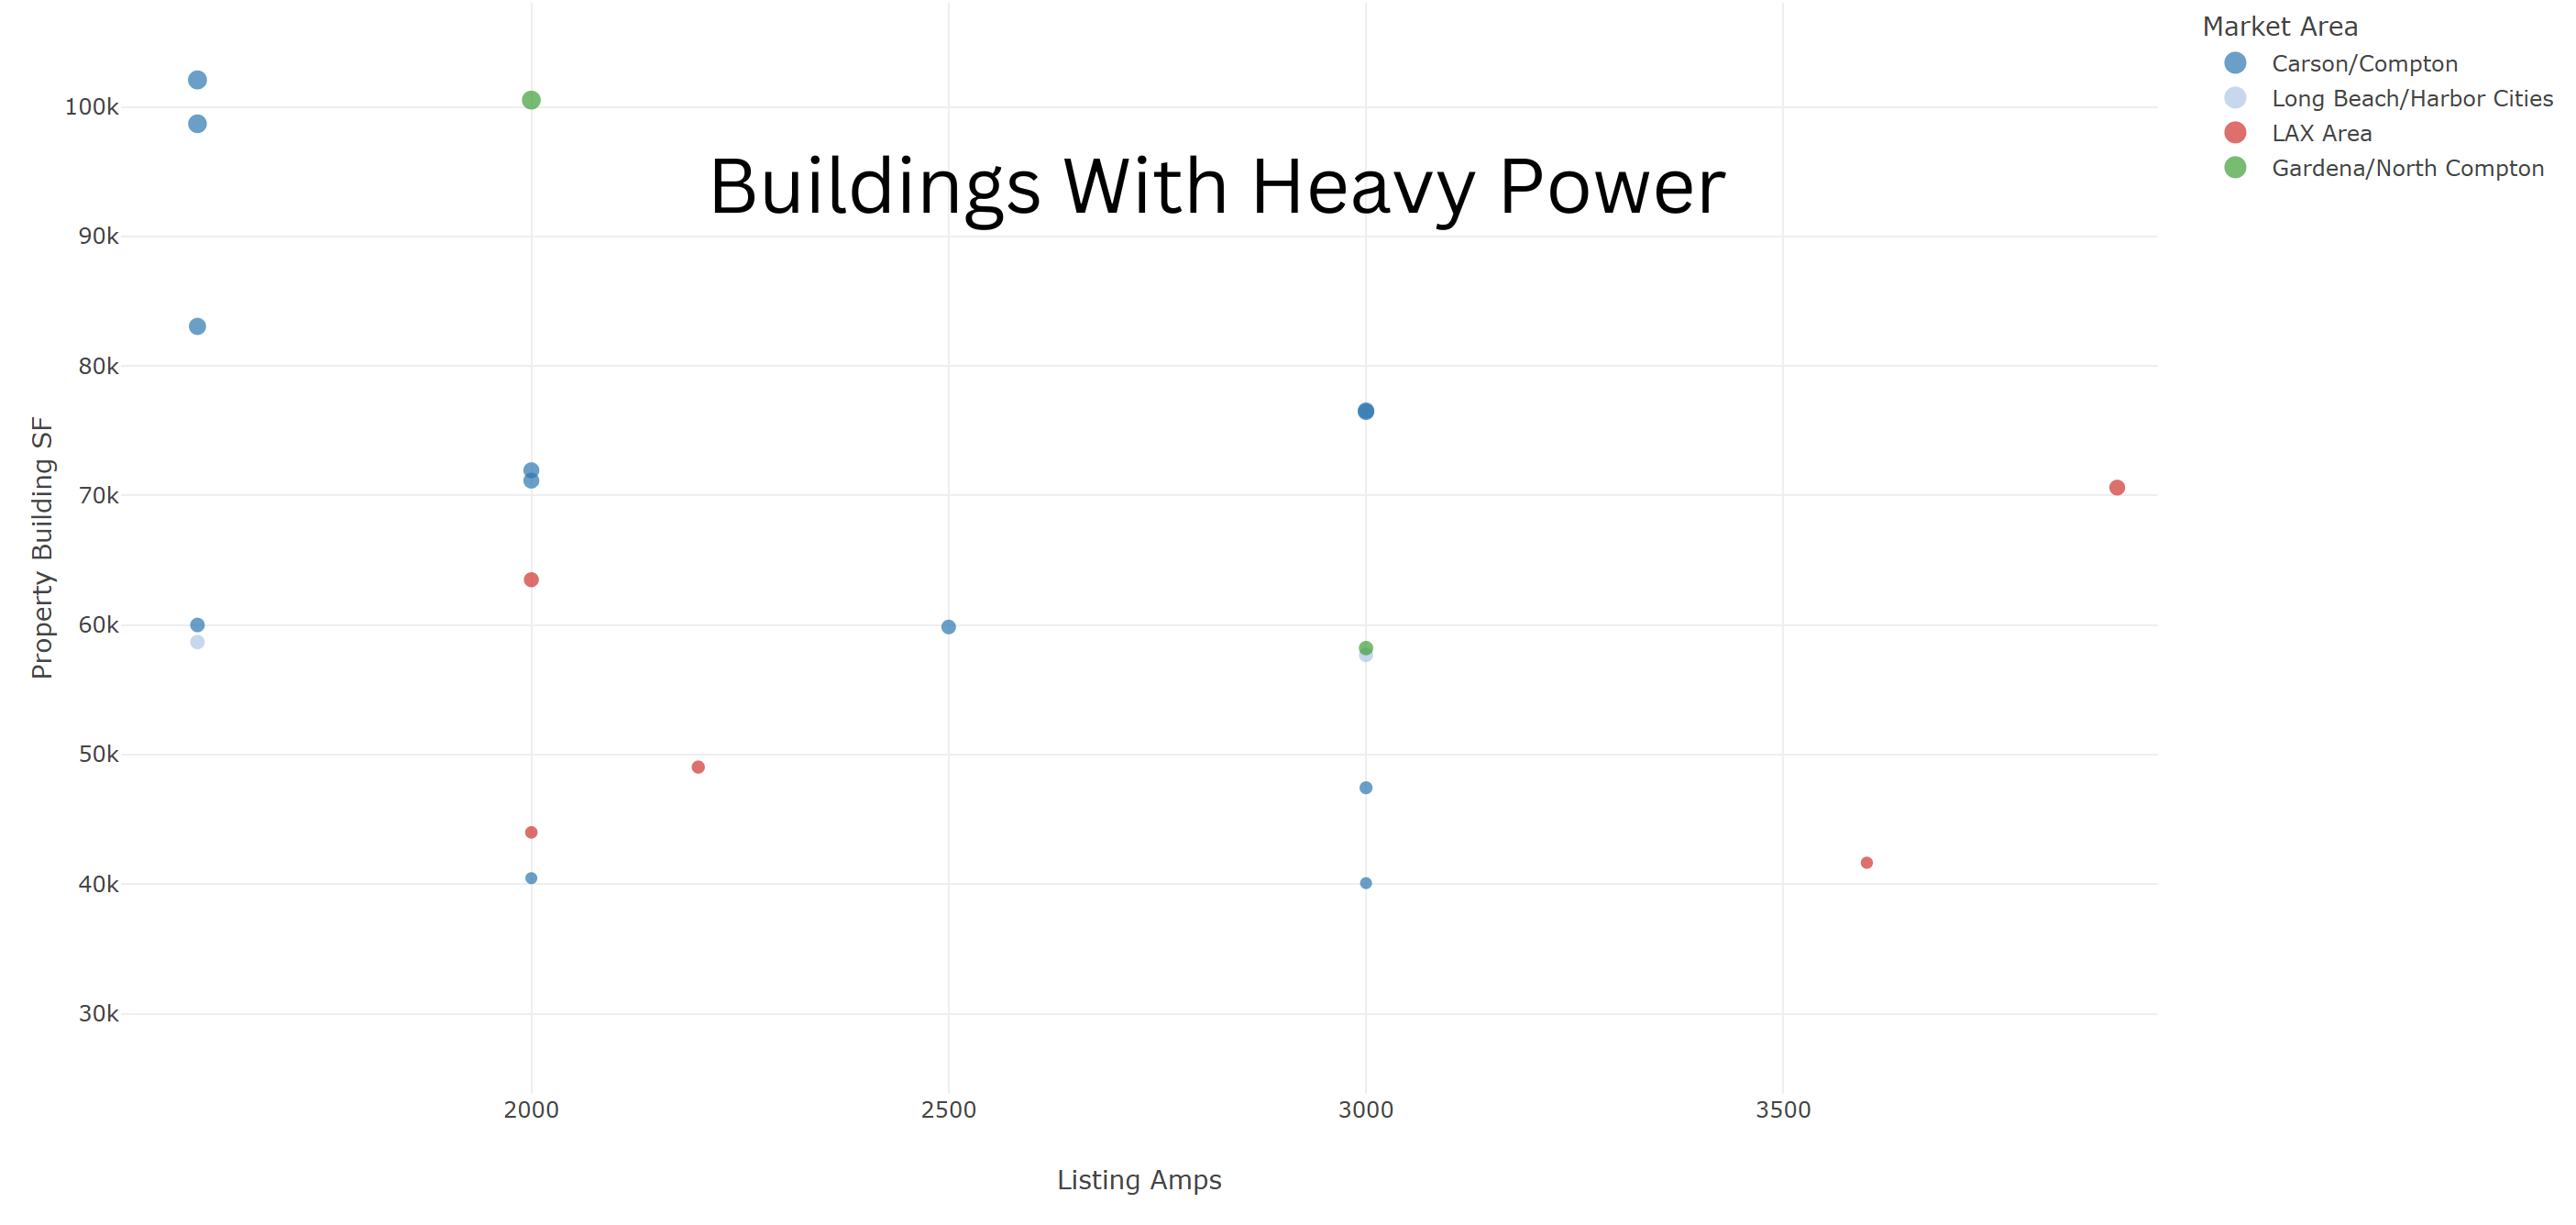
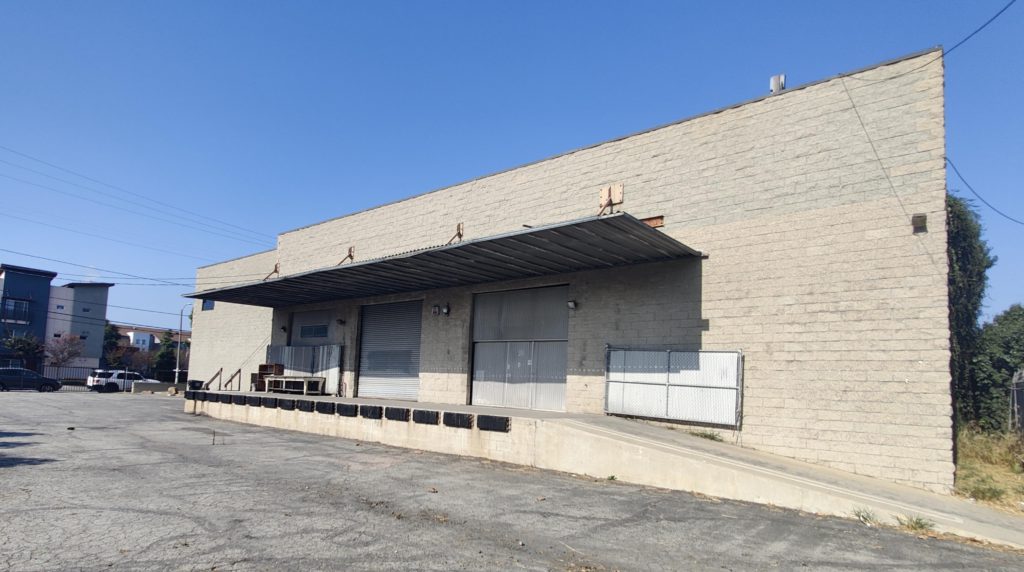
1. **Building Configuration Mismatch**: Warehouse buildings optimized for distribution often lack:
– Sufficient power infrastructure for manufacturing equipment
– Appropriate floor load capacity for heavy machinery
– Ceiling heights suitable for manufacturing processes
– HVAC systems designed for production environments
– Office-to-warehouse ratios needed for engineering teams
2. **Location Requirements**: Hard tech companies require:
– Proximity to specialized talent pools
– Access to research institutions and universities
– Clustering near similar companies for knowledge sharing
– Locations that attract highly skilled workers
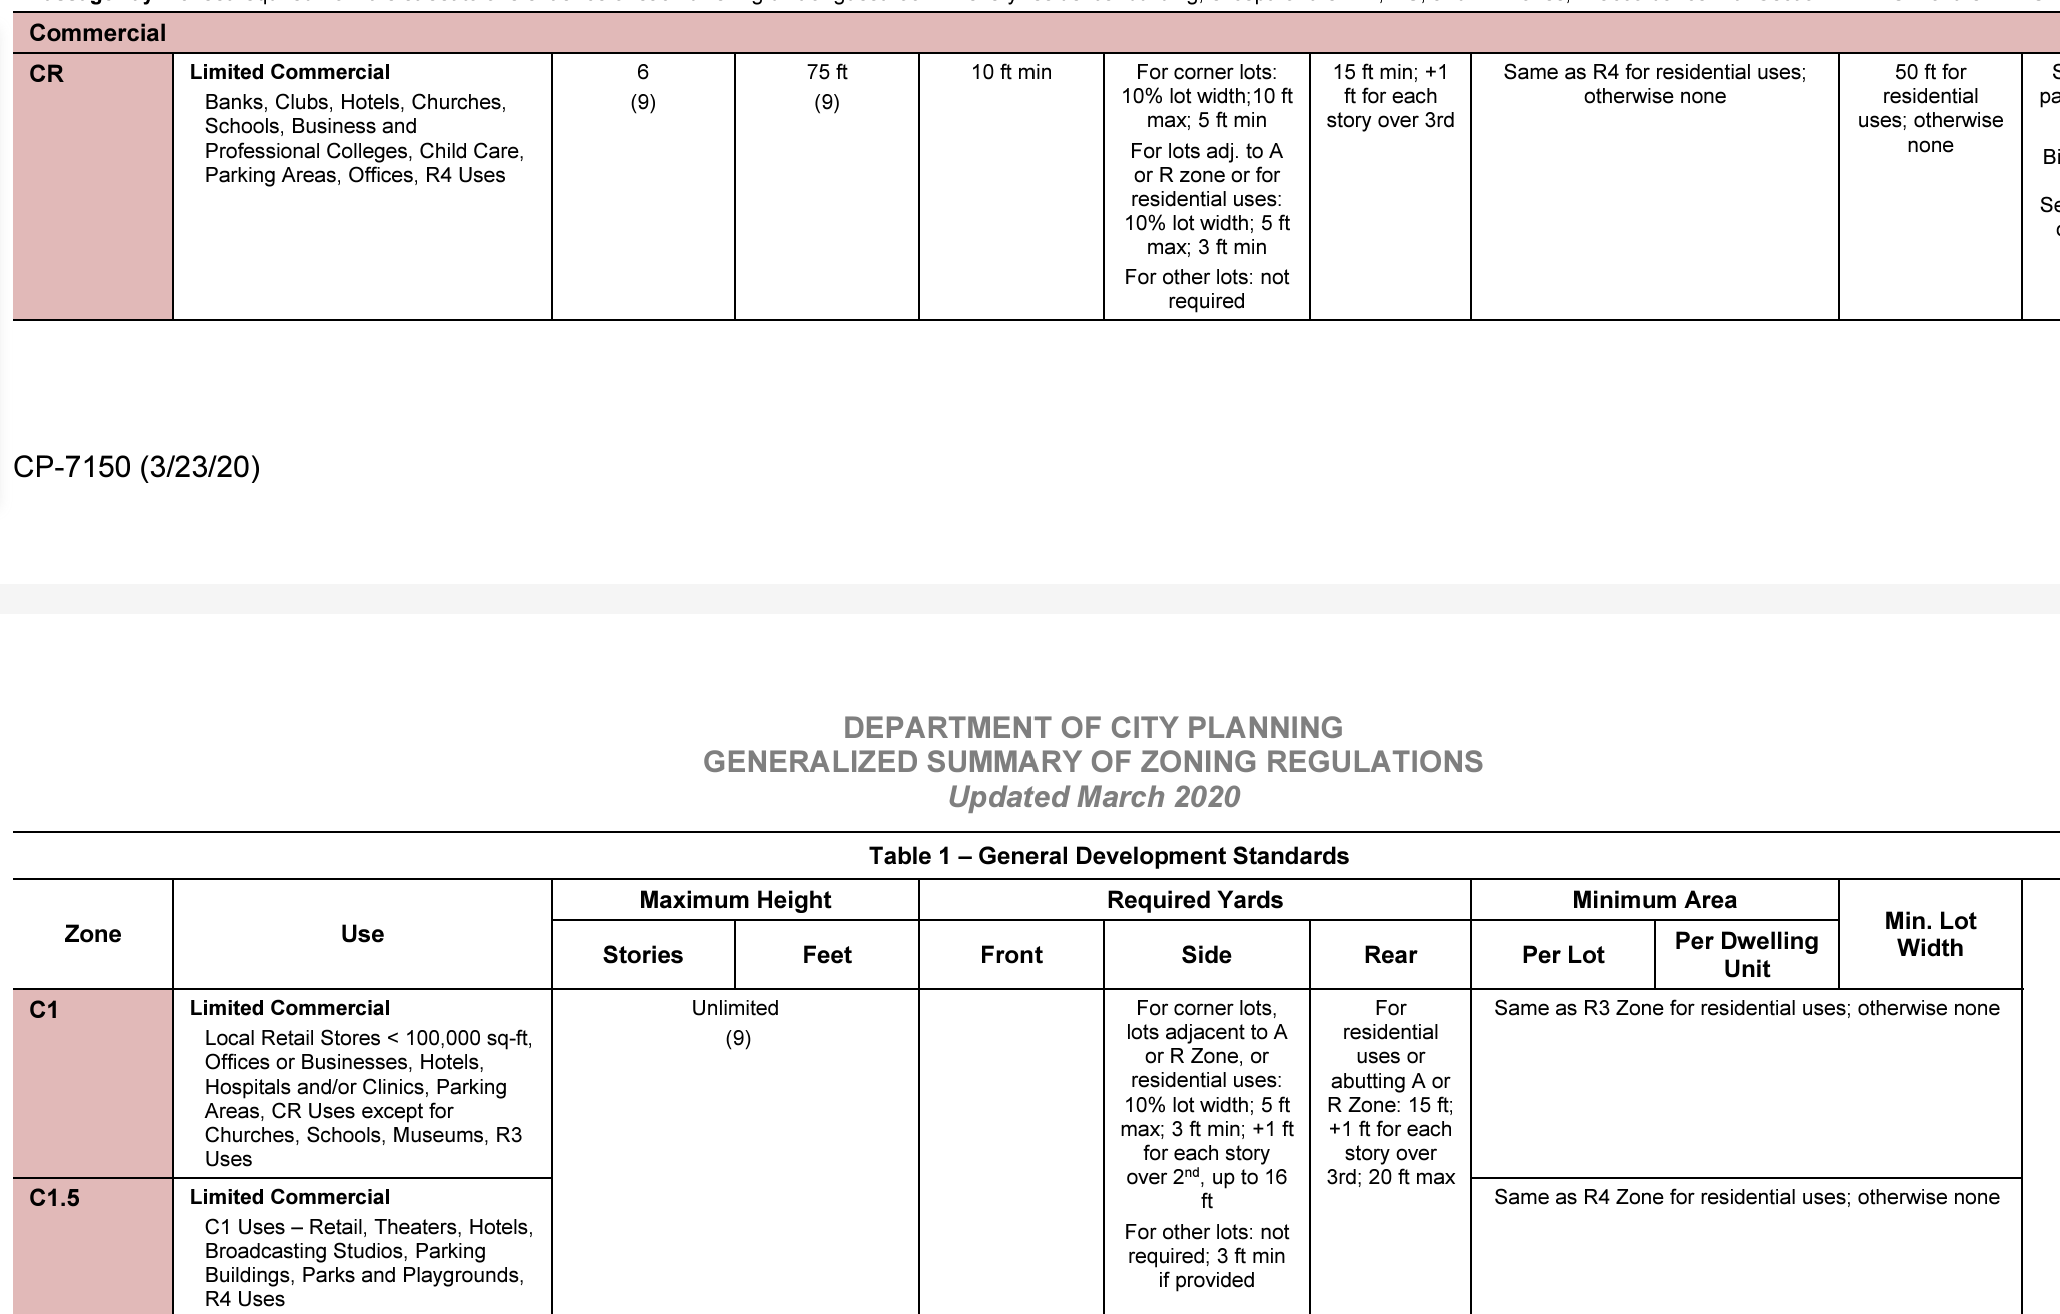
3. **Regulatory Considerations**: Manufacturing operations face different regulatory requirements than warehousing:
– Zoning restrictions may limit manufacturing in areas zoned for warehousing
– Environmental permits may be more complex for manufacturing
– Utility access and infrastructure needs differ significantly
## Revised Investment Opportunities
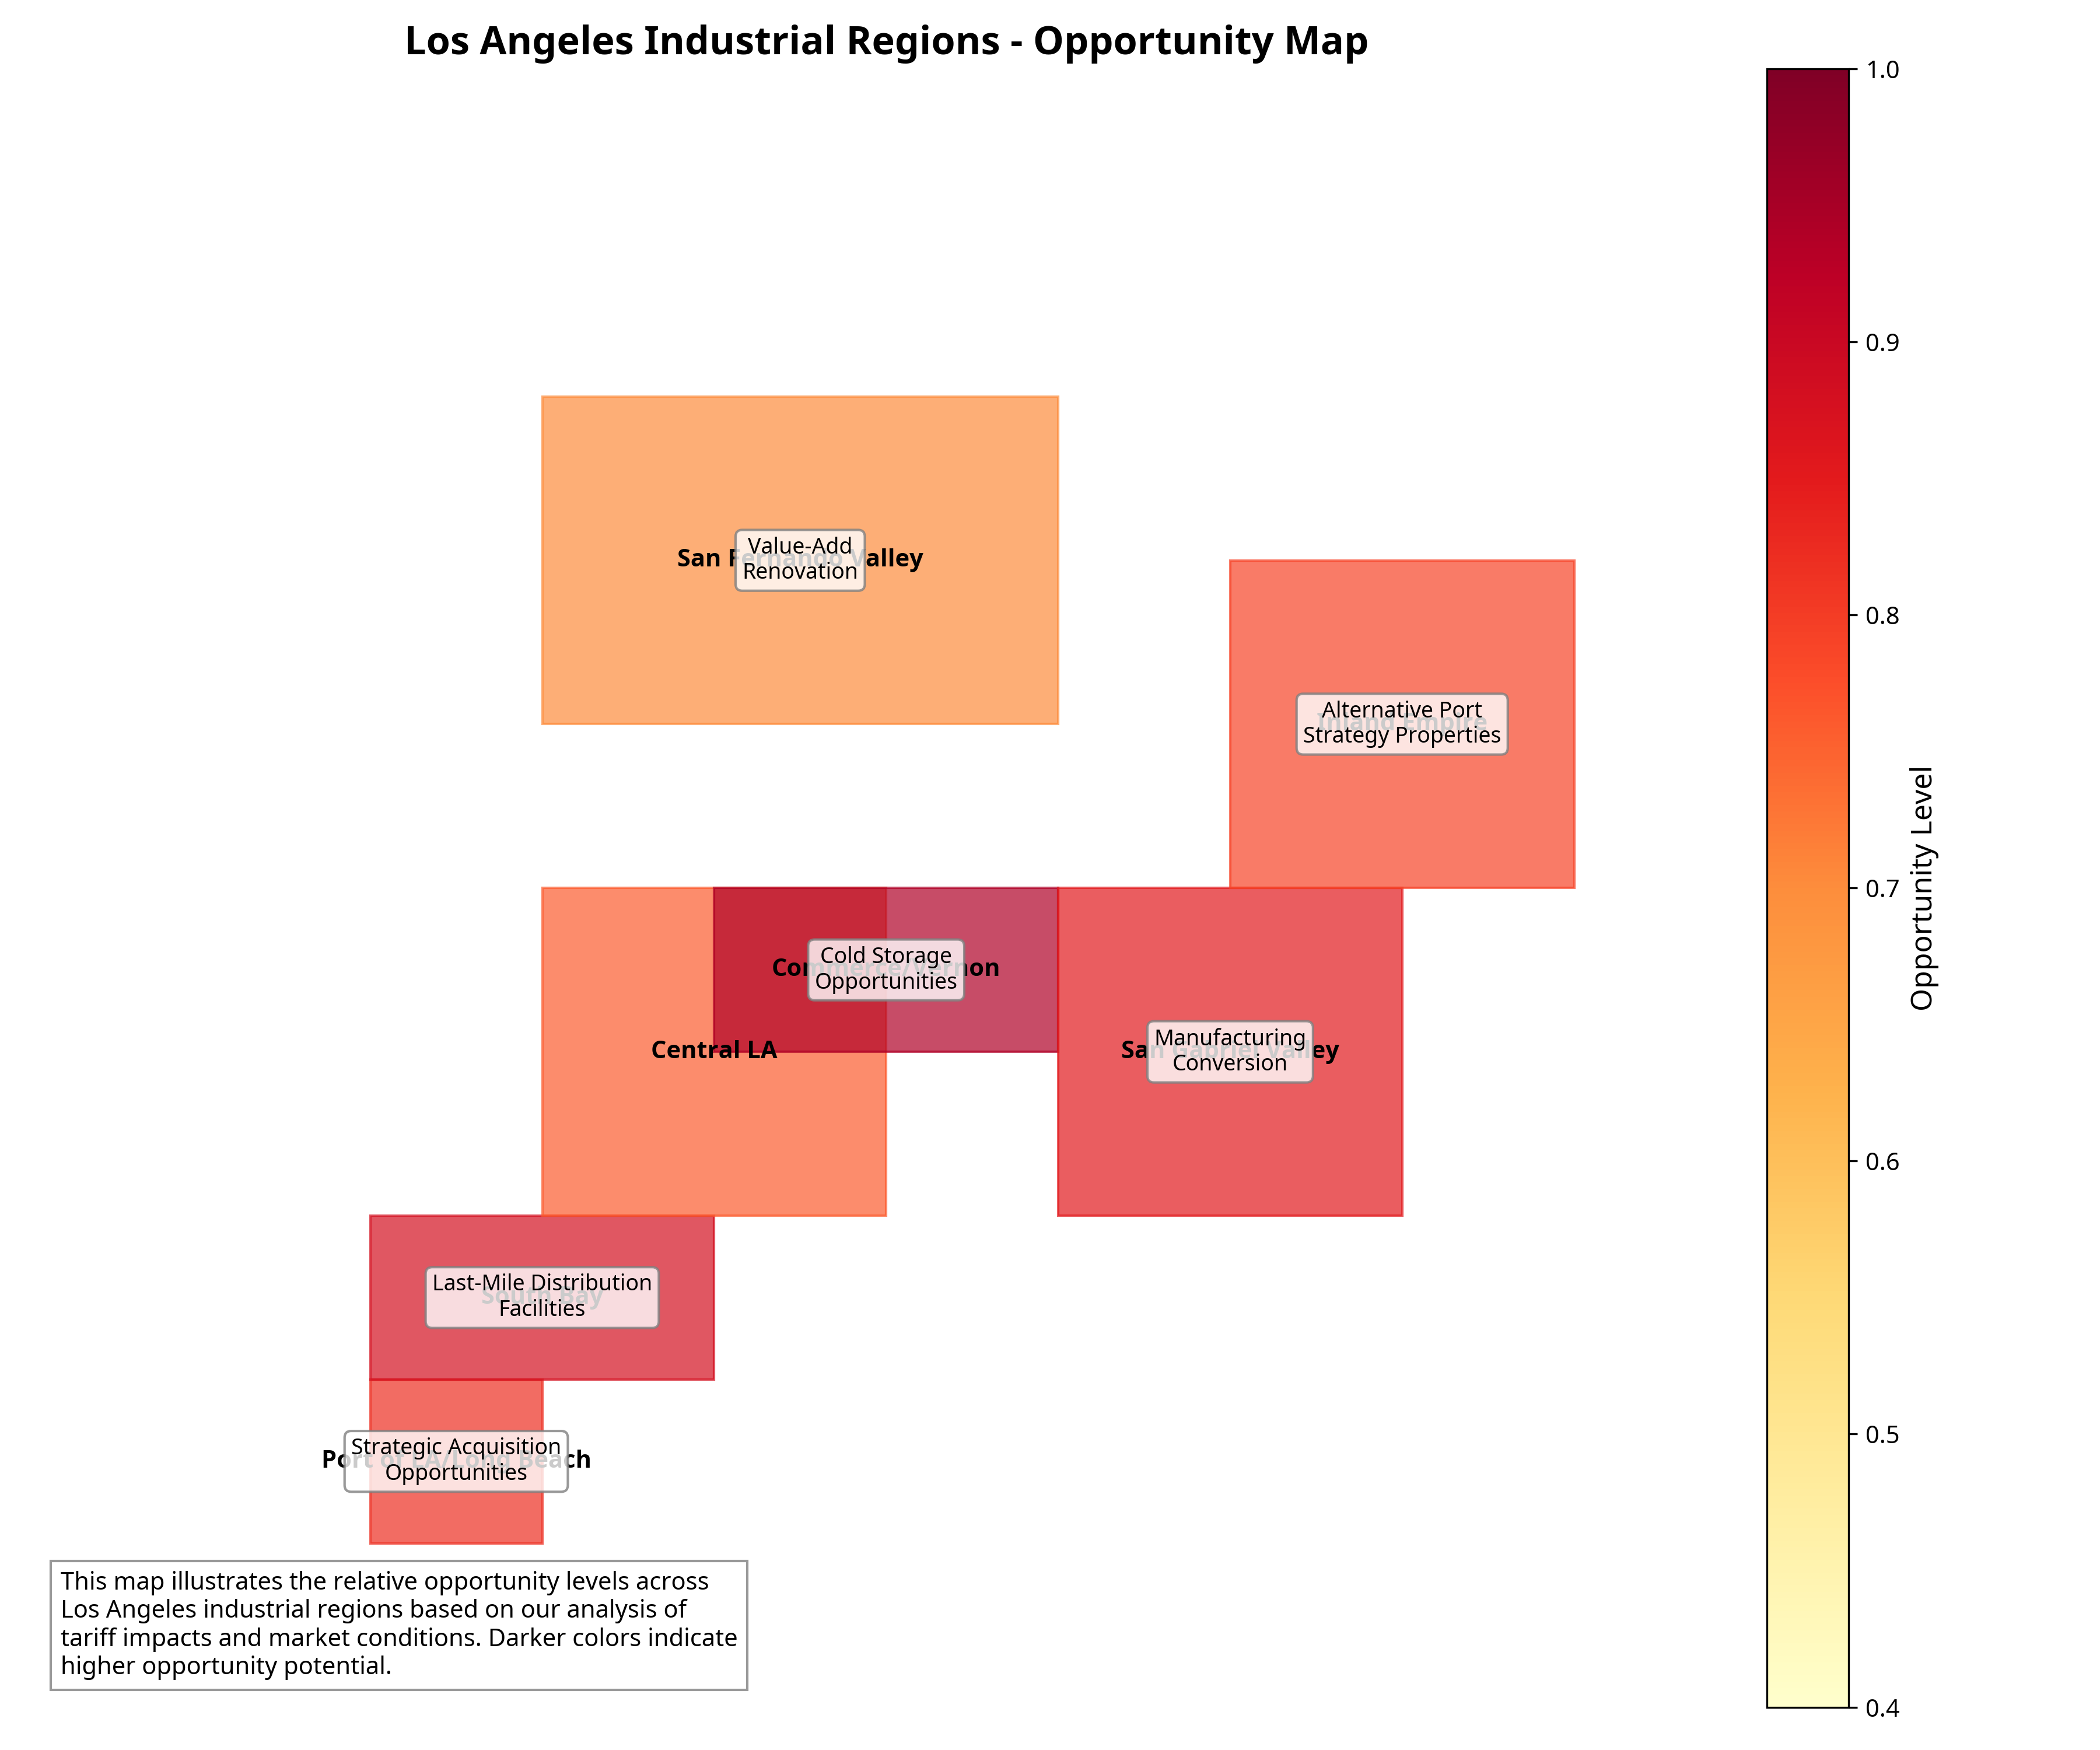
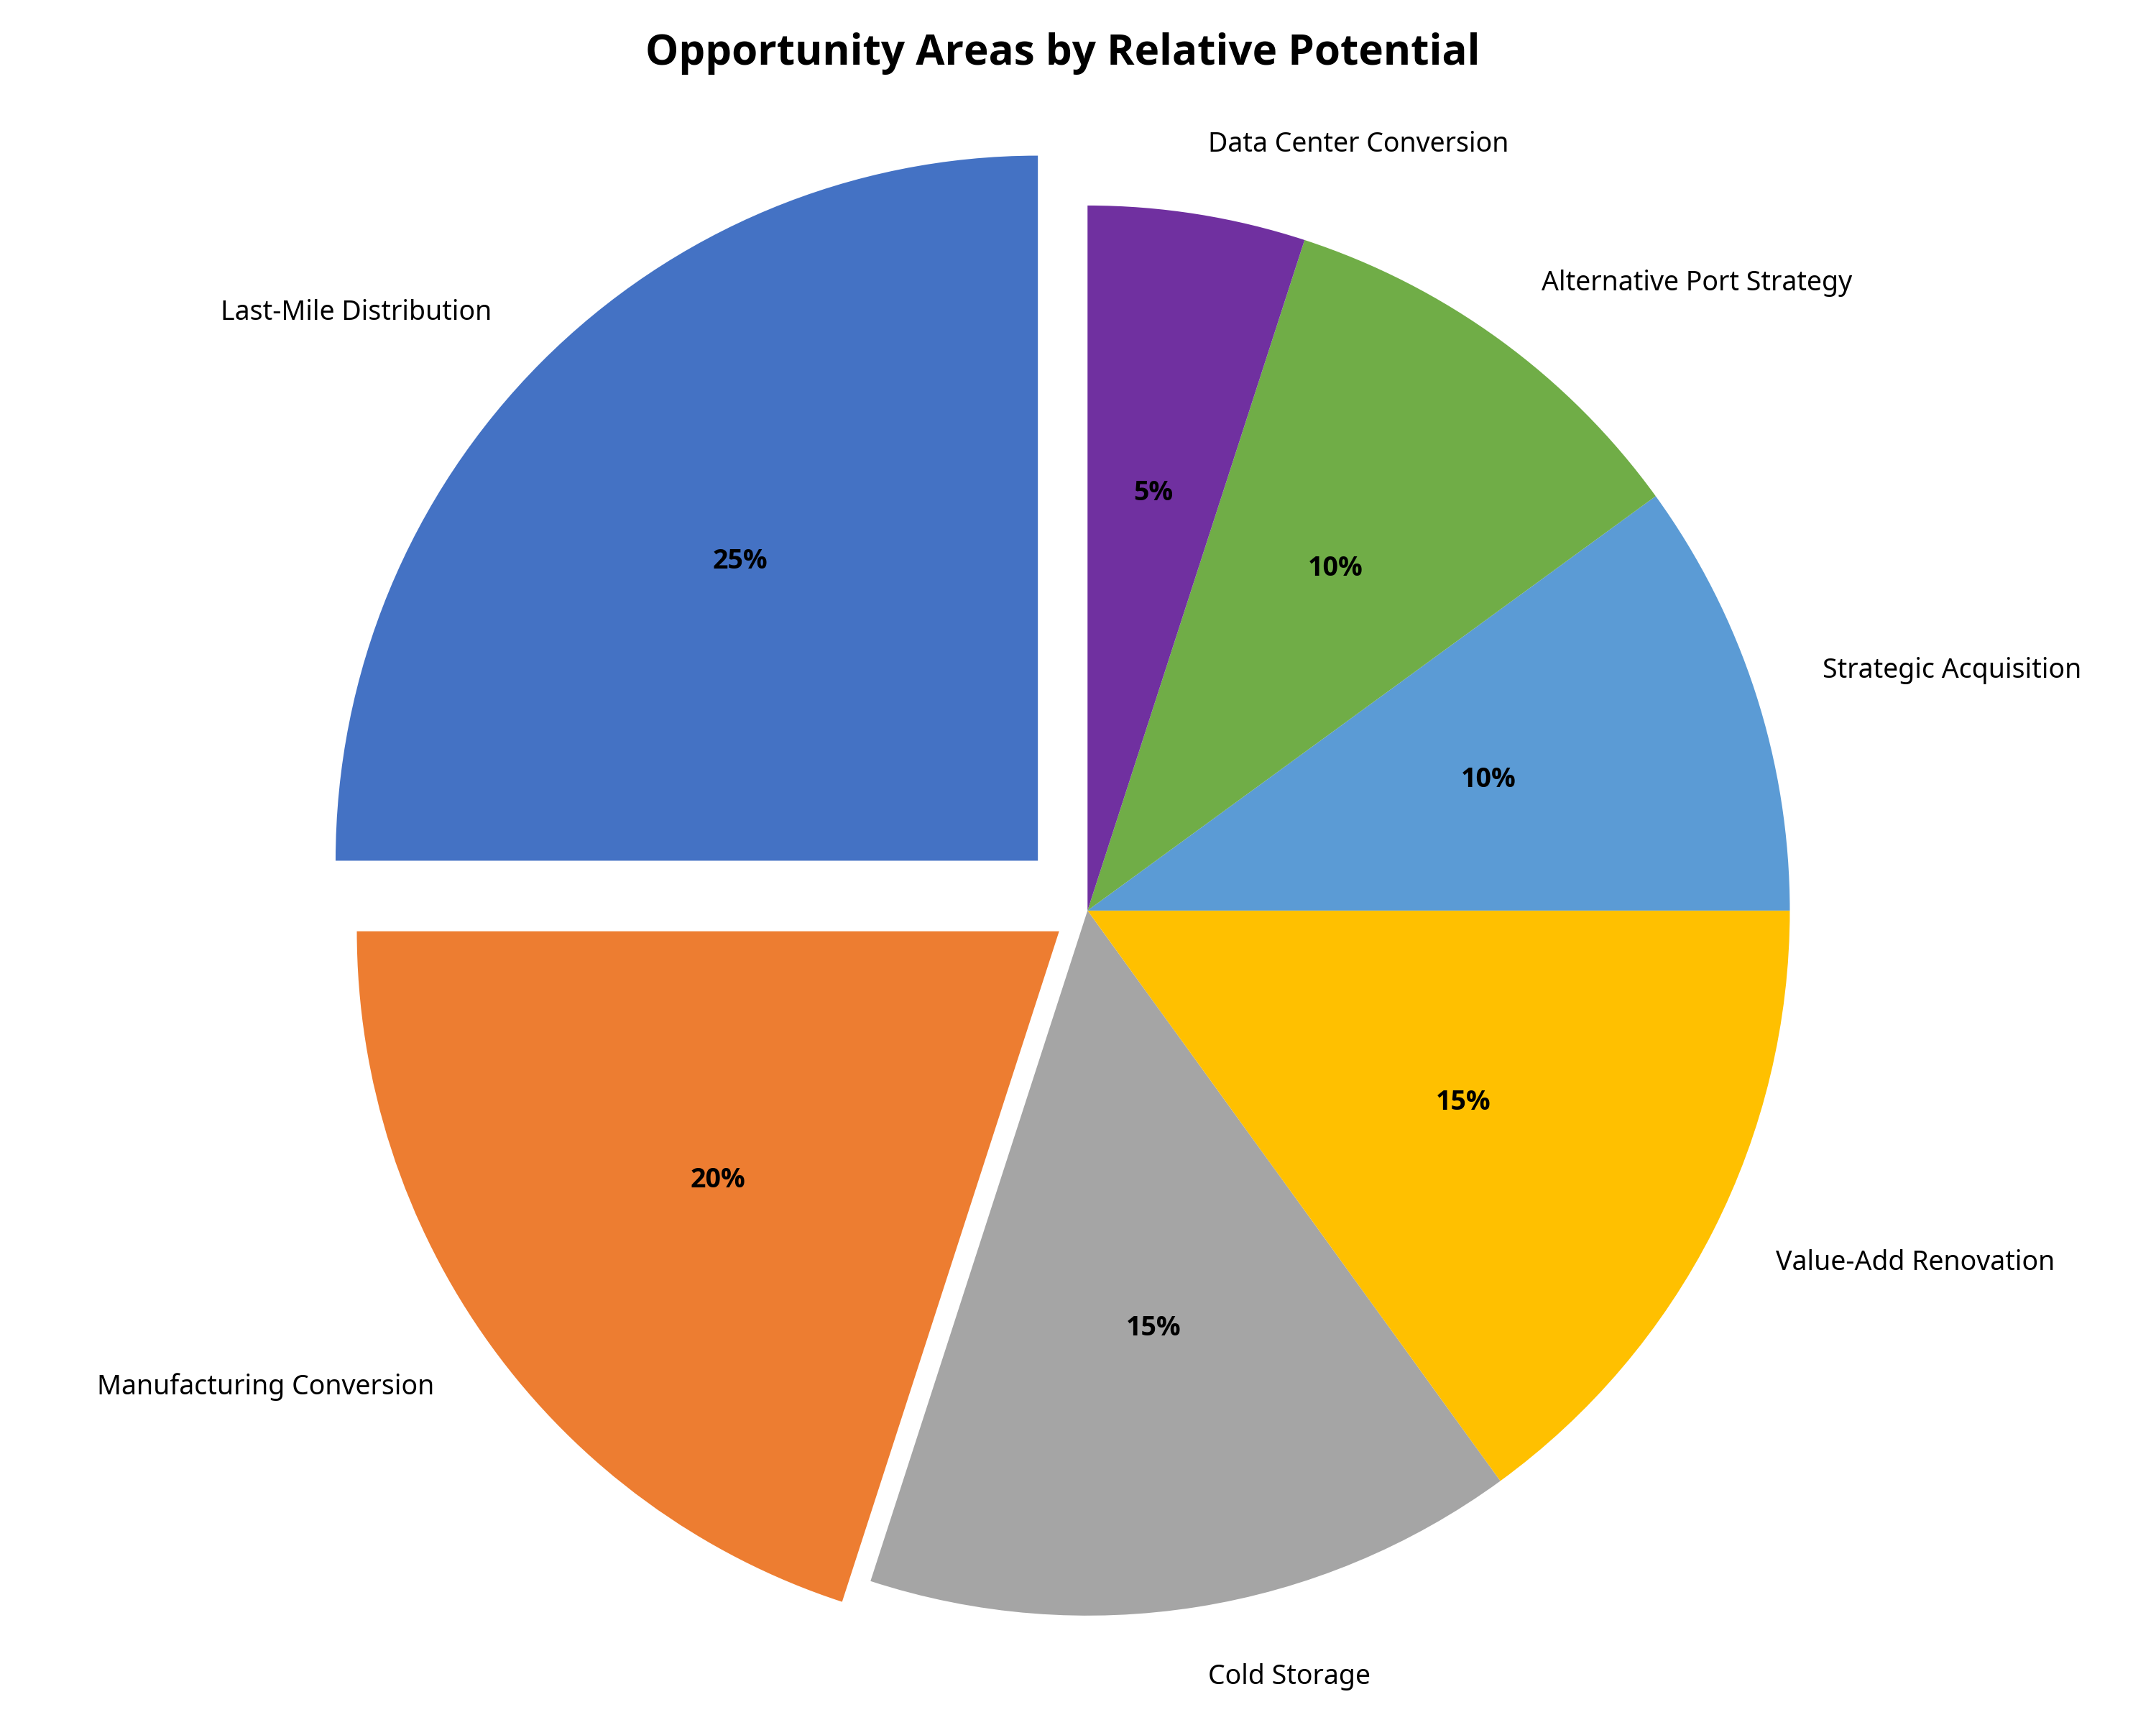
Based on this updated perspective, we’ve revised our assessment of key opportunity areas in Los Angeles industrial real estate:
1. **Manufacturing Conversion Opportunities** *(Elevated Priority)*: Properties suitable for conversion to manufacturing use, particularly those with:
– Higher power capacity or upgrade potential
– Stronger floor load capacity
– Flexible floor plans adaptable to production
– Locations in or near South Bay innovation clusters
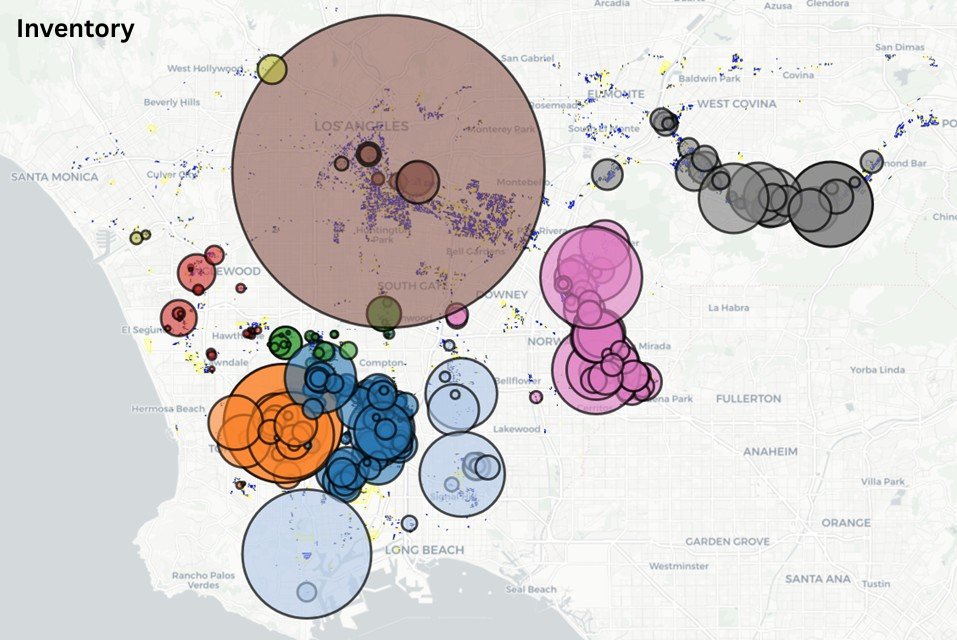
2. **Hard Tech Clustering Zones** *(New Opportunity)*: Properties located within existing hard tech clusters, particularly in:
– El Segundo
– Torrance
– Hawthorne (near SpaceX)
– Redondo Beach
– Manhattan Beach
3. **Last-Mile Distribution Facilities** *(Reduced Priority)*: While still valuable, these face increased competition and potential oversupply.
4. **Cold Storage and Specialized Facilities** *(Maintained Priority)*: These remain valuable due to specialized requirements and limited supply.
5. **Value-Add Renovation for Manufacturing** *(Elevated Priority)*: Older industrial properties that can be upgraded specifically to meet manufacturing requirements.
6. **Strategic Acquisition of Undervalued Assets** *(Refined Focus)*: Focus on properties with manufacturing conversion potential rather than general warehouse assets.
7. **Alternative Port Strategy Properties** *(Reduced Priority)*: Less emphasis given shift away from distribution-focused strategy.
8. **Data Center Conversion** *(Maintained Priority)*: Industrial properties with robust power infrastructure remain valuable for both data centers and manufacturing.
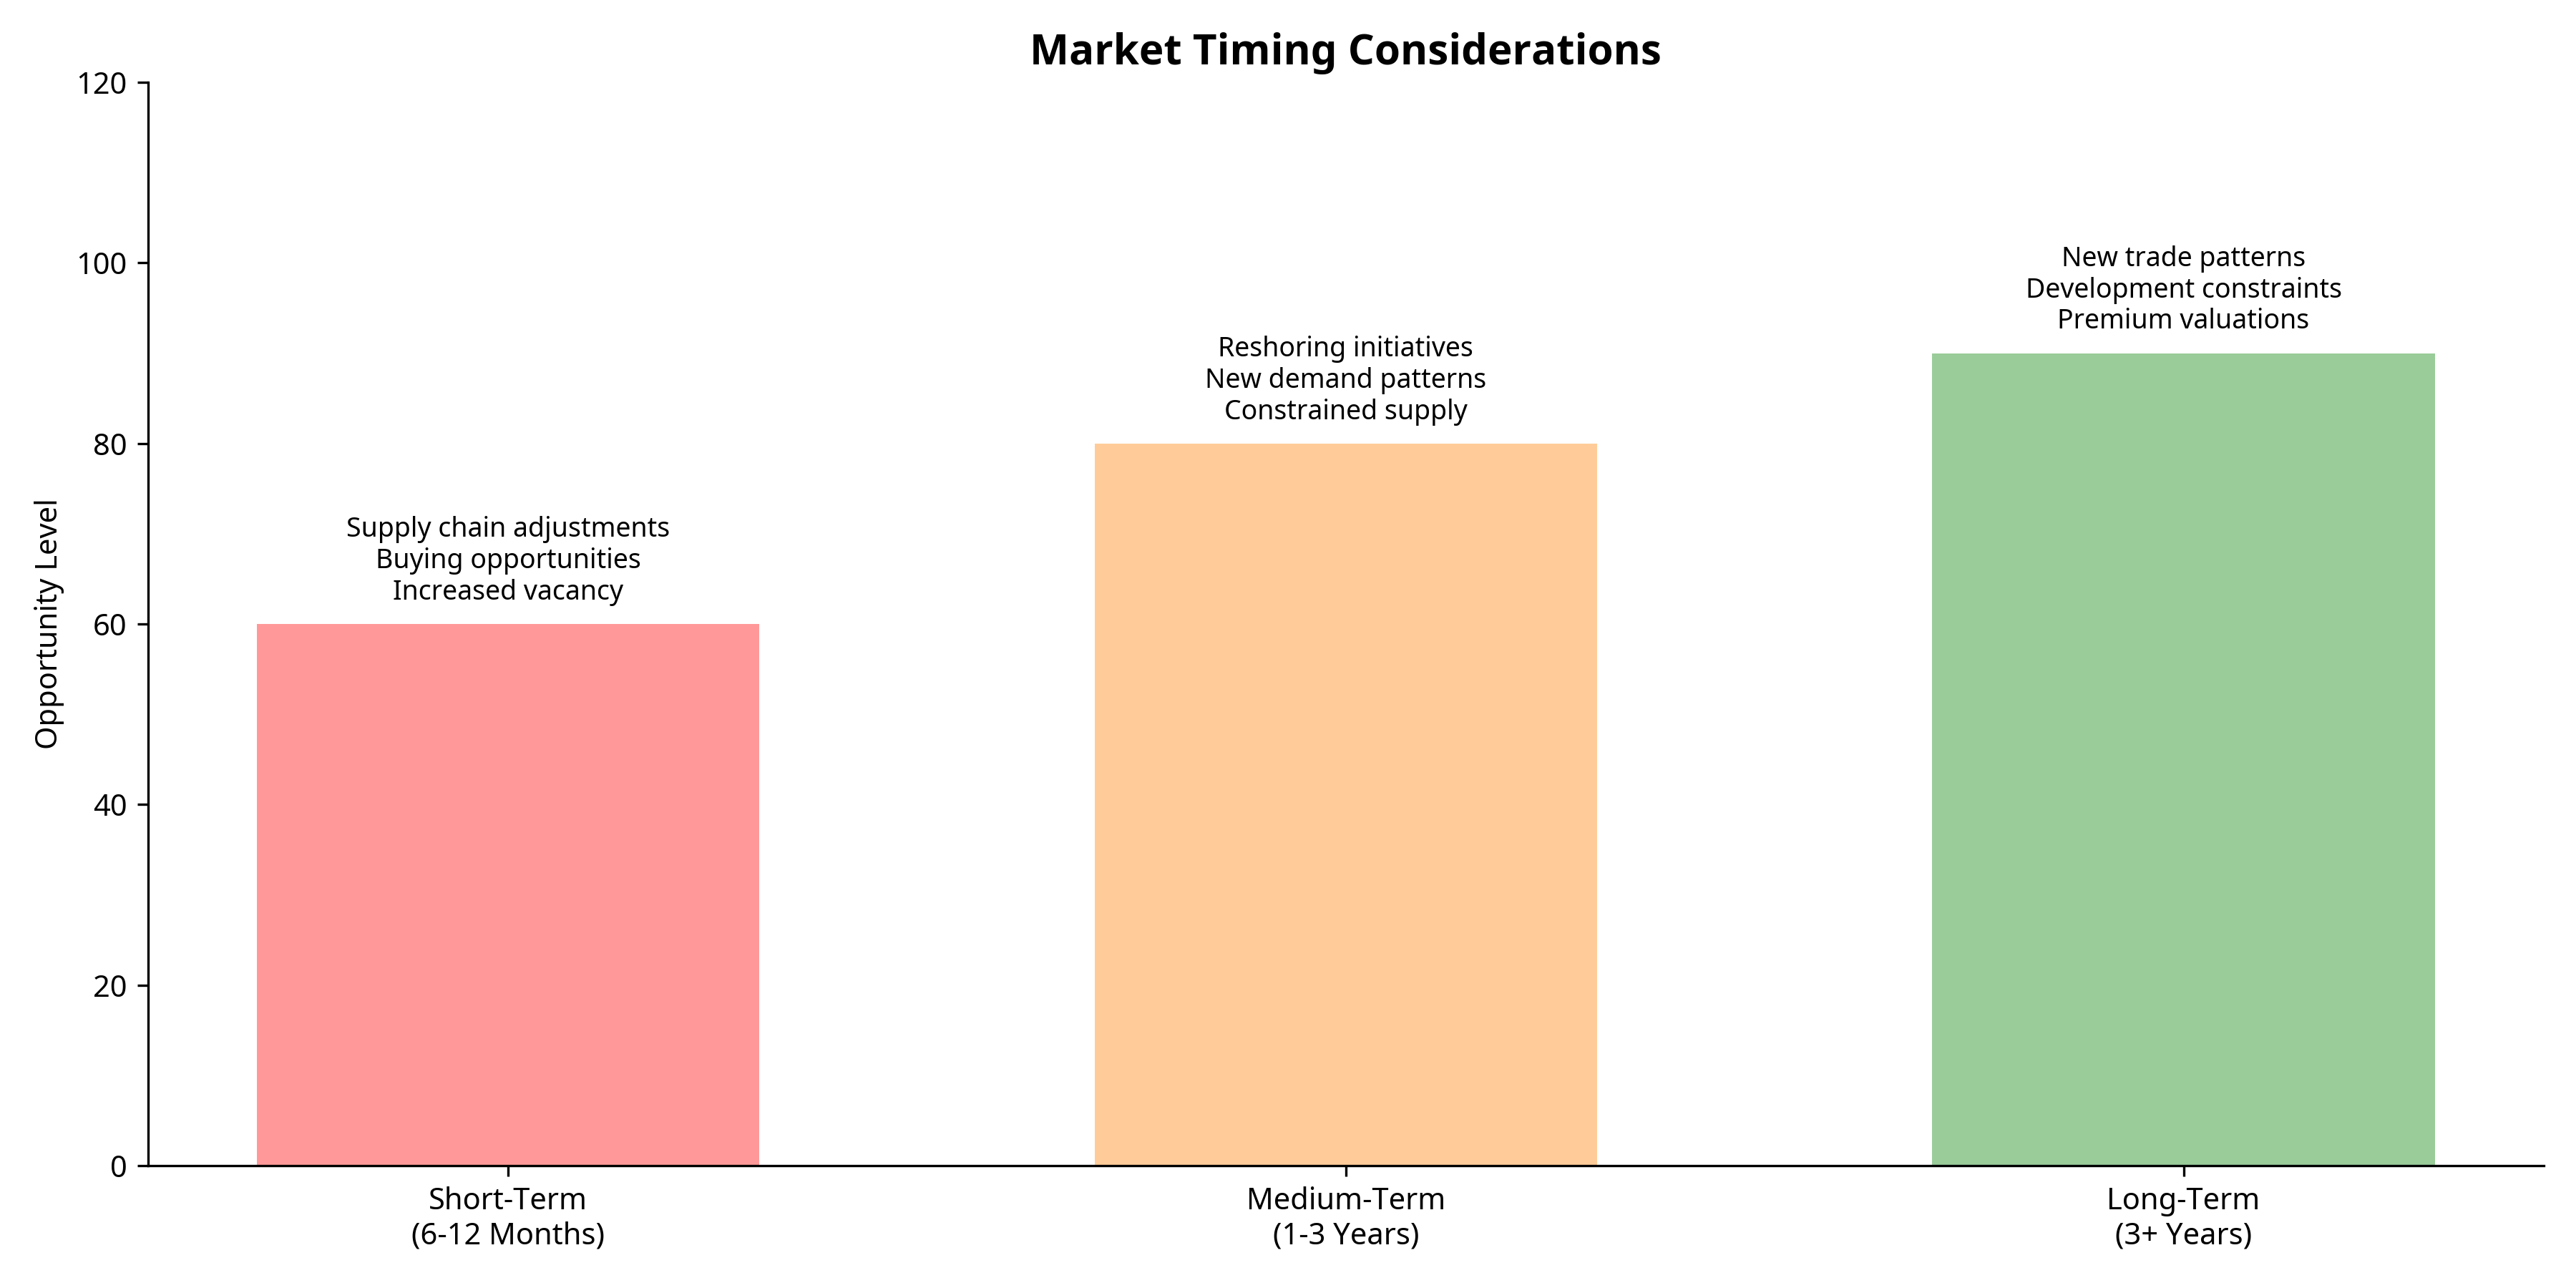
## Market Outlook with Revised Perspective
The Los Angeles industrial market’s fundamental strengths remain intact, but our outlook has shifted to emphasize:
1. **Adaptive Reuse Wave**: Expect significant capital investment in converting distribution-focused buildings to manufacturing use.
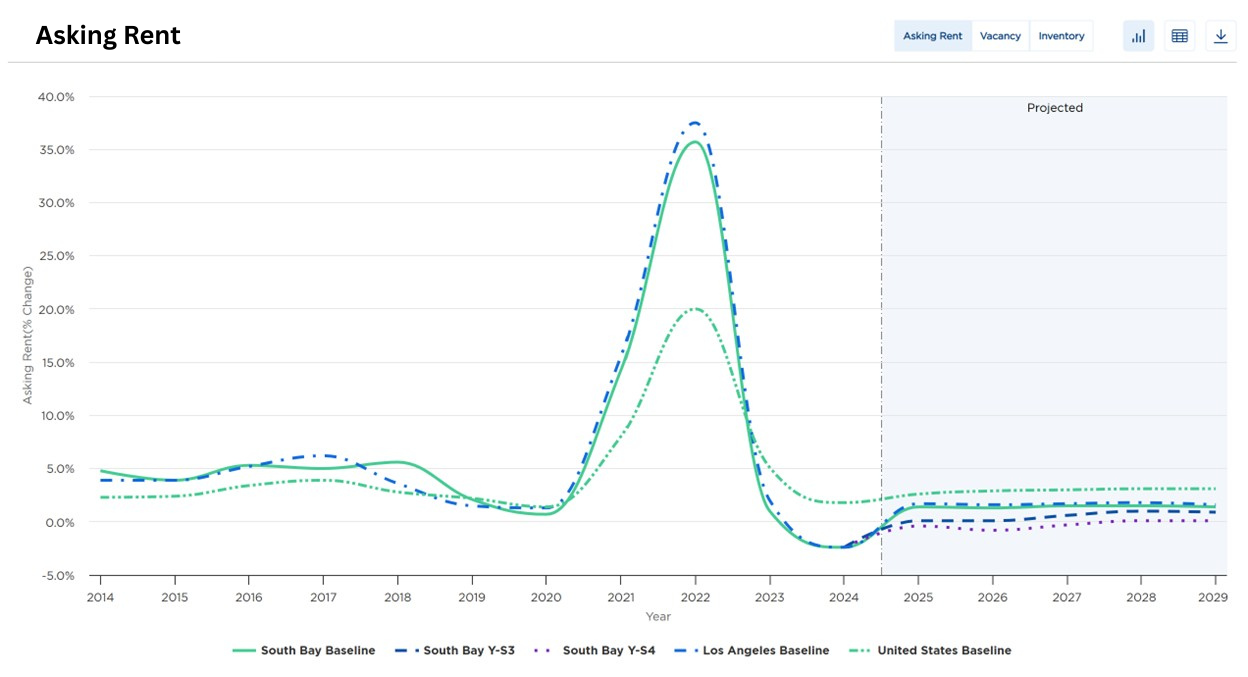
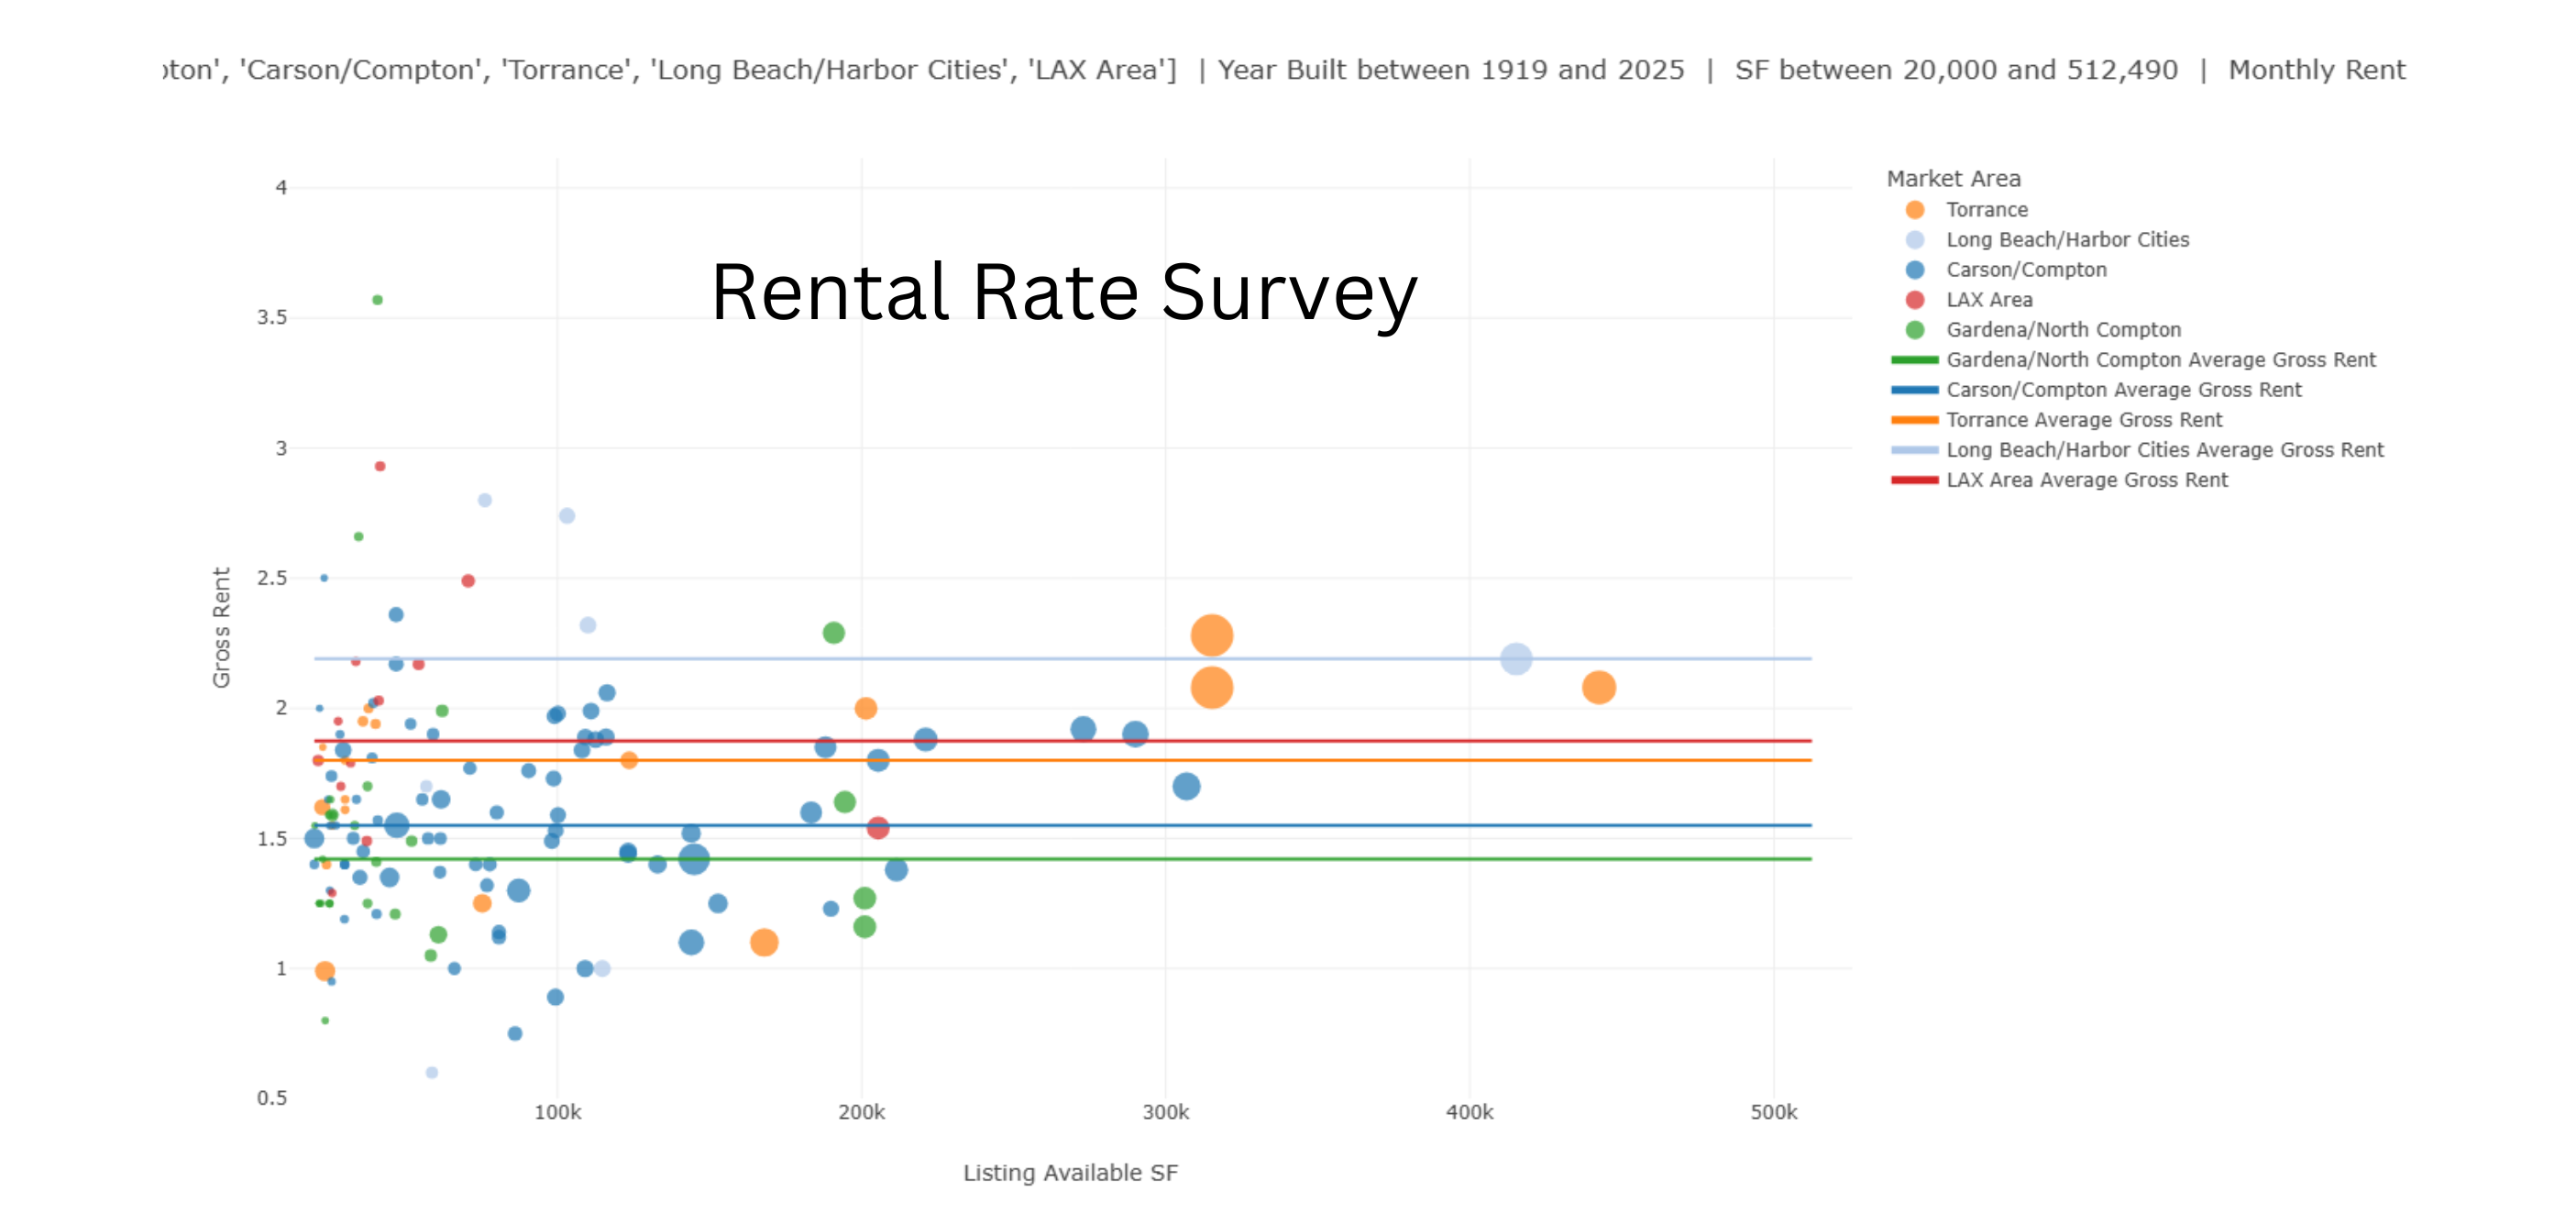
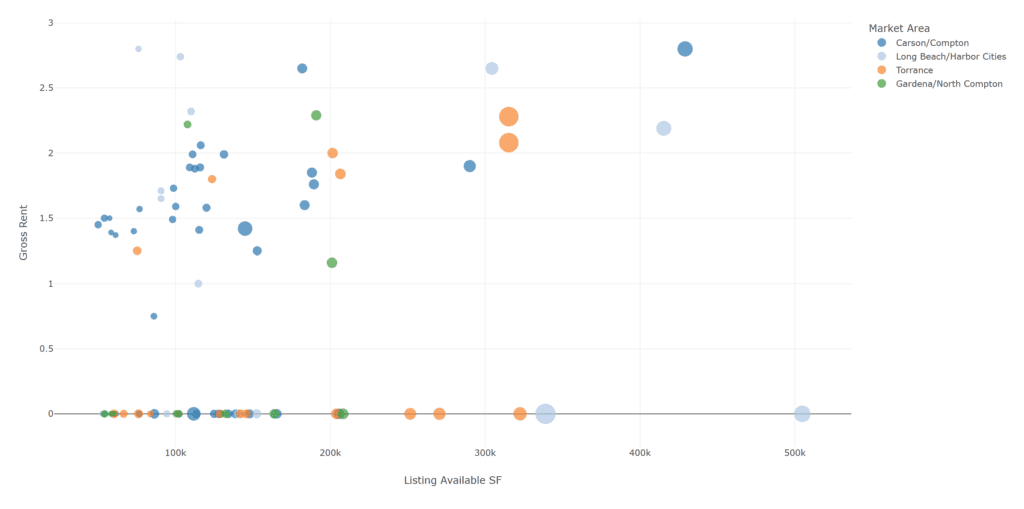
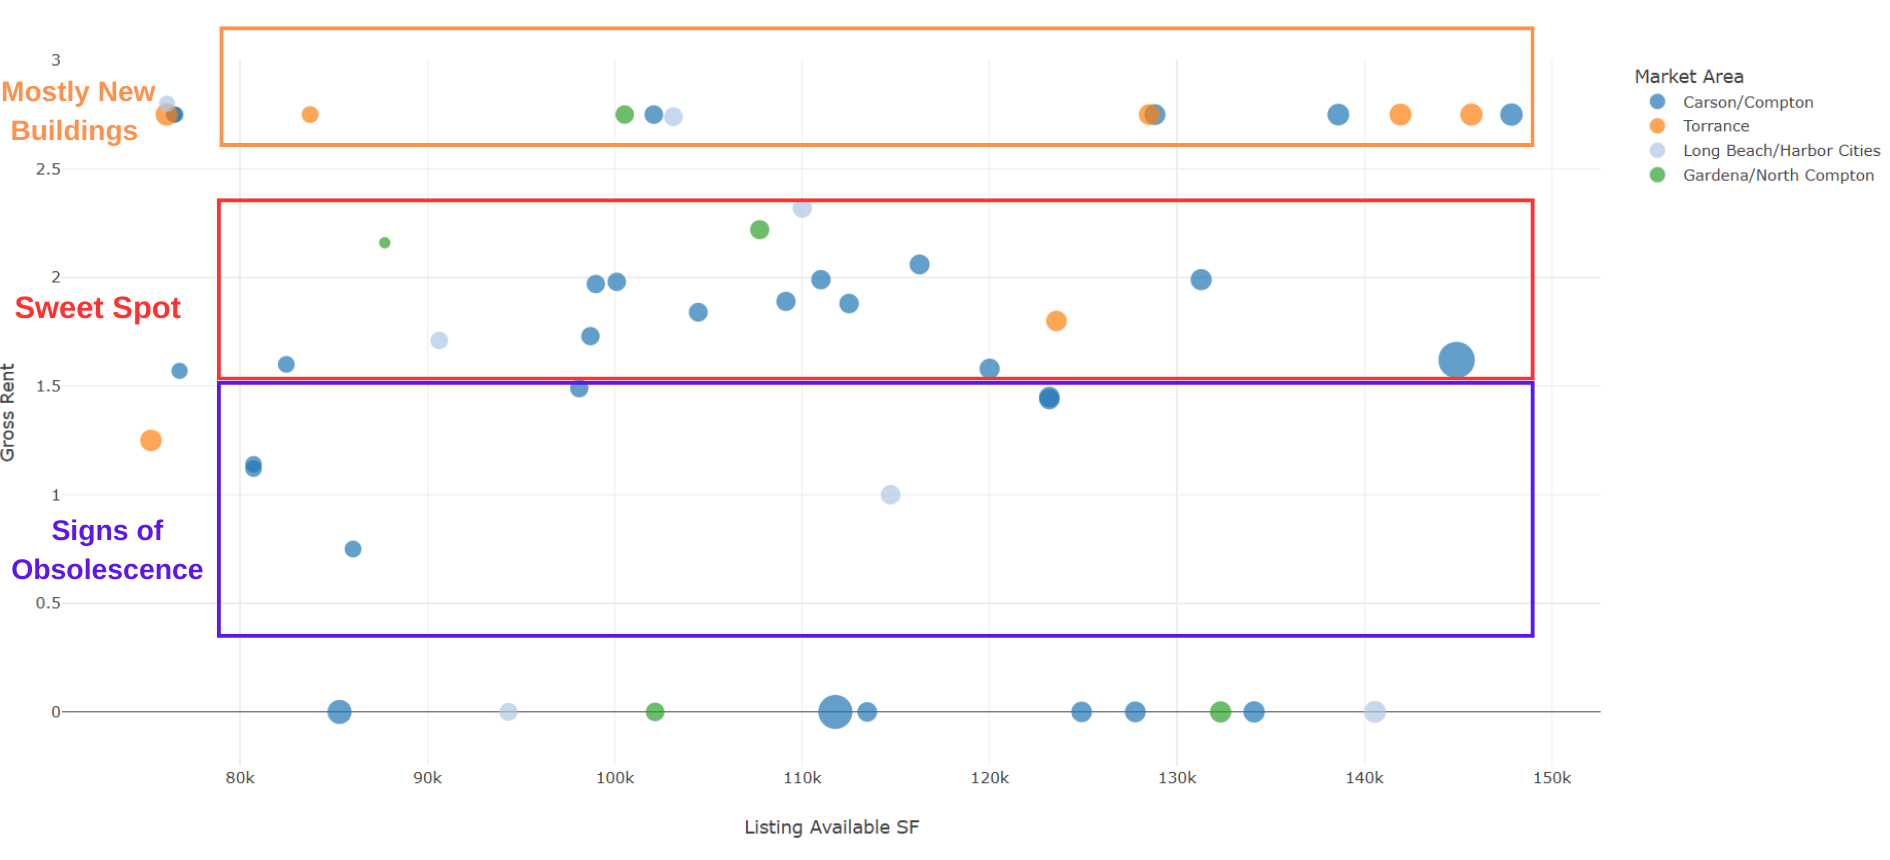
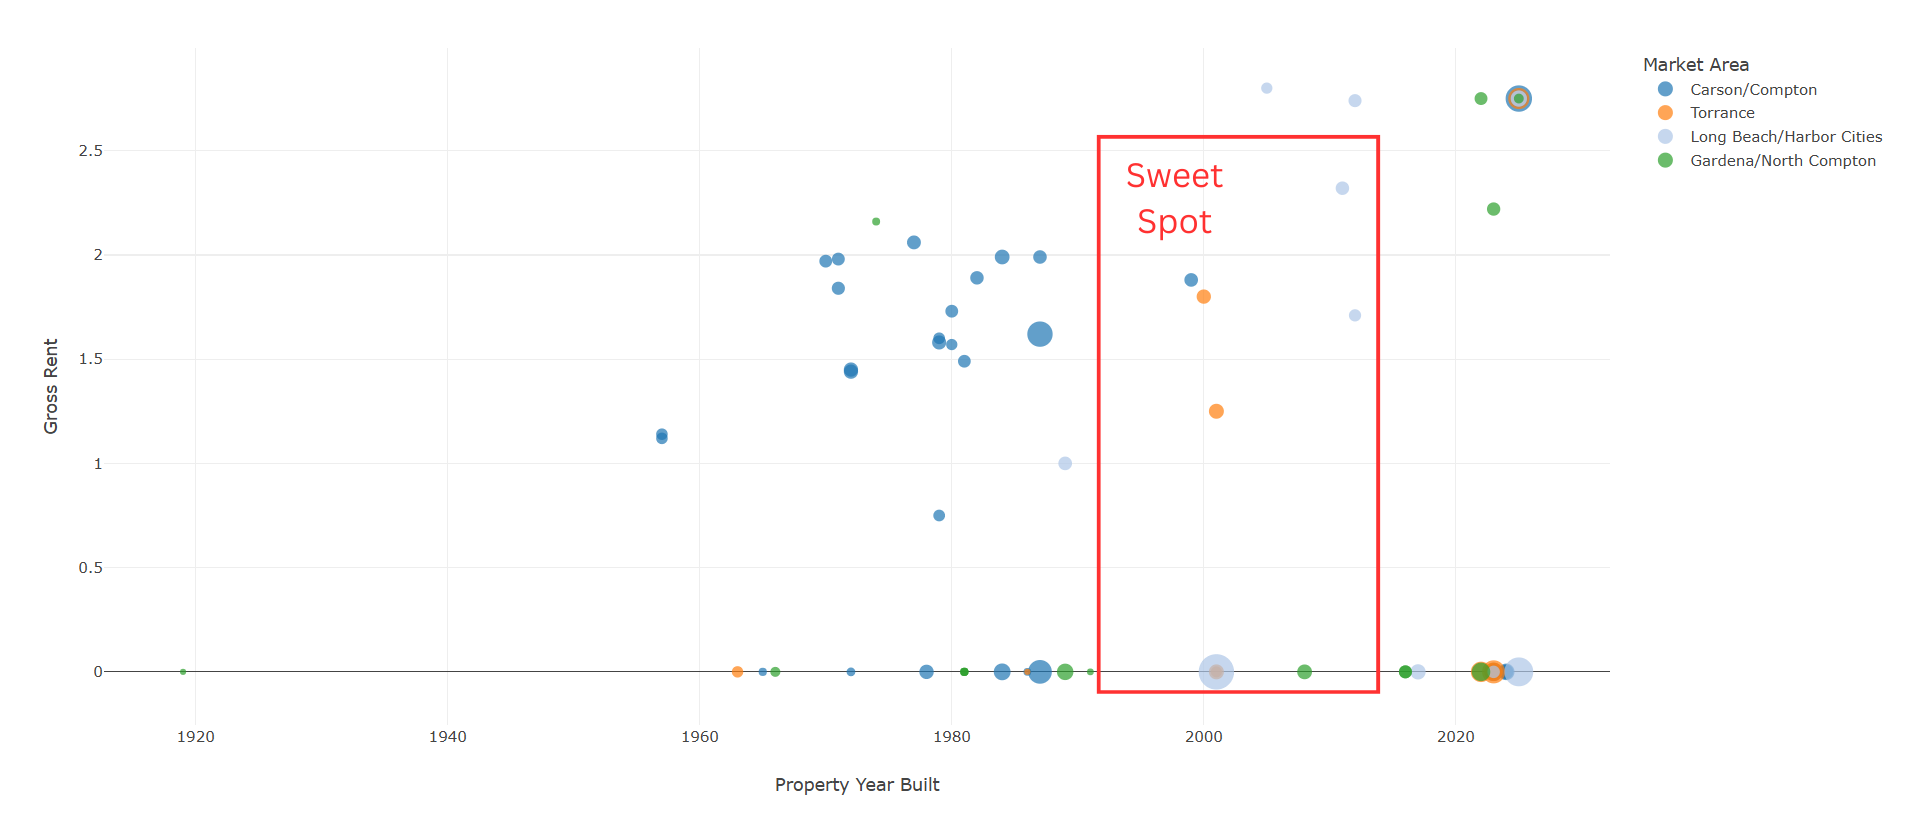
2. **Rental Rate Divergence**: Properties suitable for manufacturing will likely command premium rents while traditional warehouse spaces see continued downward pressure.
3. **Development Pipeline Shift**: Future development may need to pivot toward buildings designed for manufacturing rather than distribution.
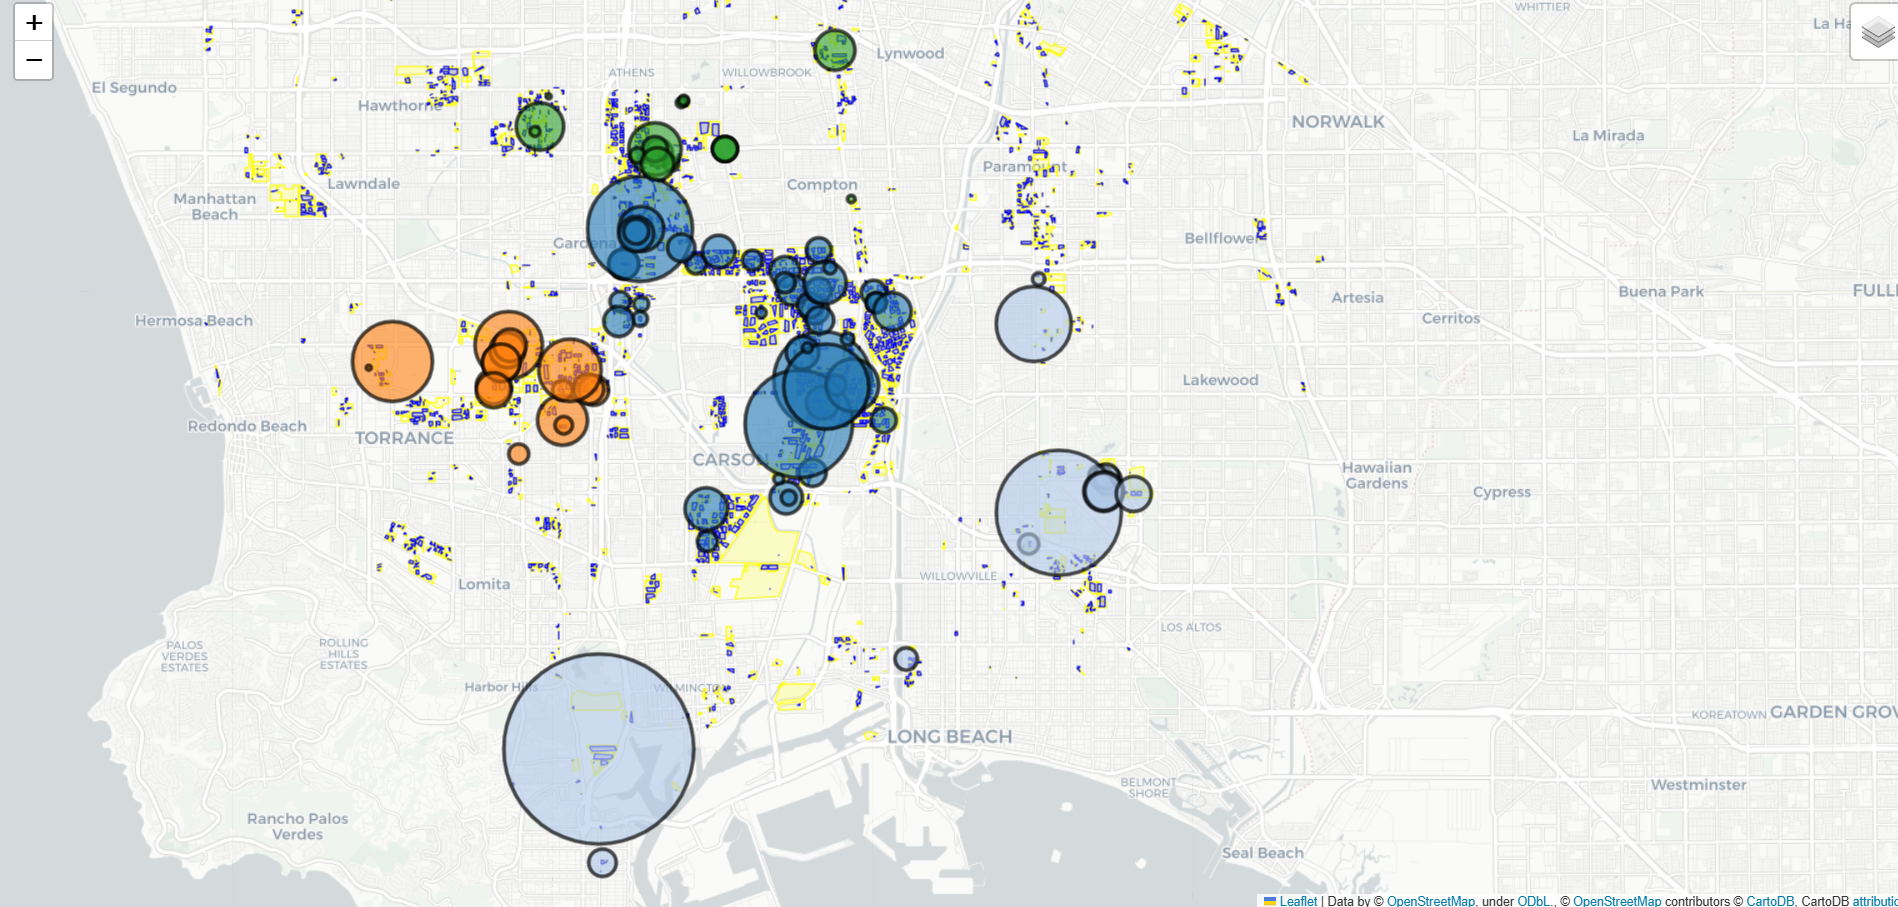
4. **Geographic Concentration**: Hard tech demand will remain particularly concentrated in the South Bay, creating micromarket dynamics that differ from broader regional trends.
5. **Long-term Value Creation**: The upcoming AB 98 regulations (effective January 2026) limiting new warehouse development for properties over 250,000 SF may actually benefit existing properties that can be repositioned for manufacturing use.
## Conclusion
The Los Angeles industrial real estate market is experiencing a significant structural shift where the supply of space (optimized for warehouse/distribution) is misaligned with current demand (increasingly from manufacturing, particularly in hard tech sectors). This creates both challenges and opportunities for property owners, developers, and investors who can recognize and adapt to this changing landscape.
The South Bay region, in particular, represents a unique opportunity given its emergence as a hard tech manufacturing hub driven by aerospace, defense, and space technology companies. Investors who can identify properties suitable for manufacturing conversion or those already positioned to serve this market segment are likely to outperform in the coming years despite broader market challenges.