Market Viewpoint
The industrial building market in Los Angeles has changed. There is a broad selection of choices. When working with tenants we generally analyze buildings for
- Total Occupancy Cost, Including Property Tax
- Space Comparison
- Cubic Foot
- Power, Height, Loading
- Ownership Concentration
We use maps and graphs to visualize the results. Users can scroll over the dots to obtain property details. When you add our experience with this data, we make finding a building easy to understand.
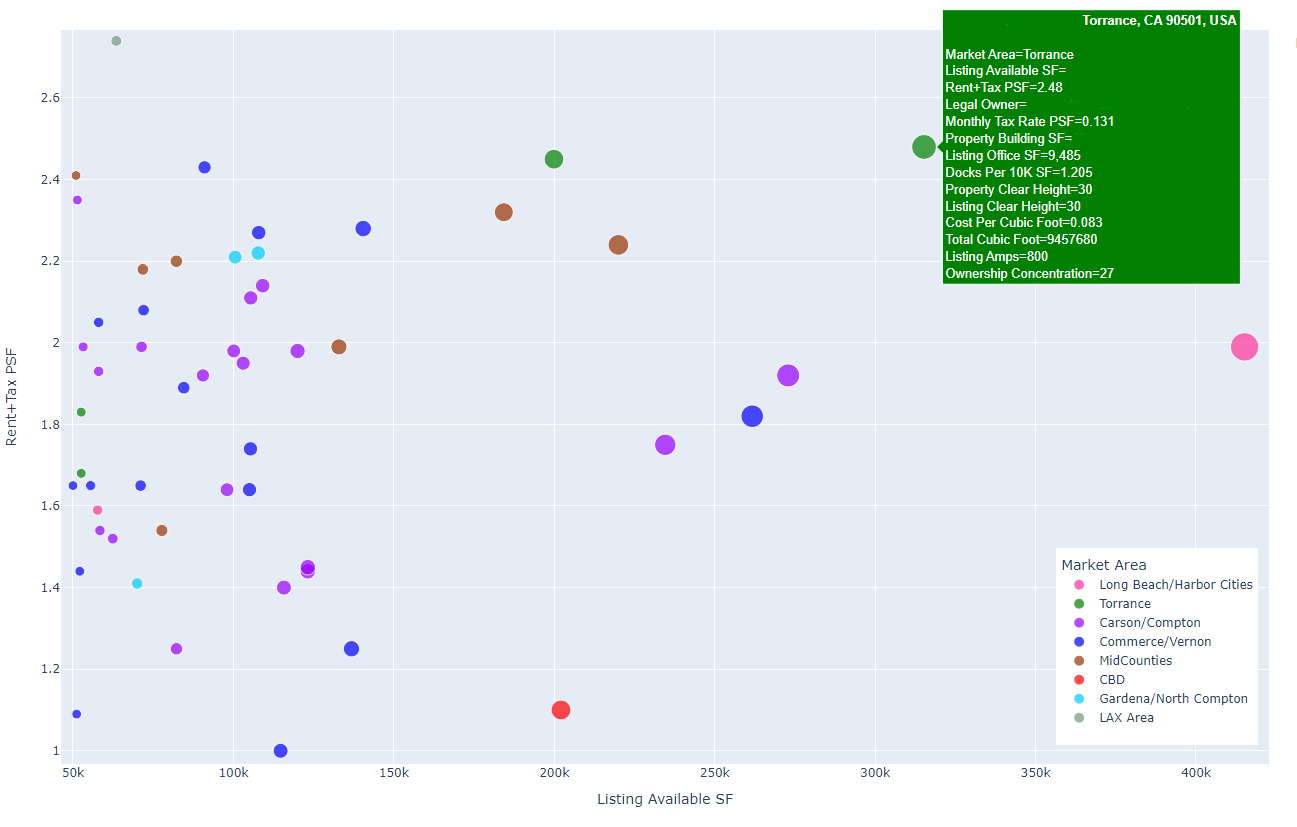
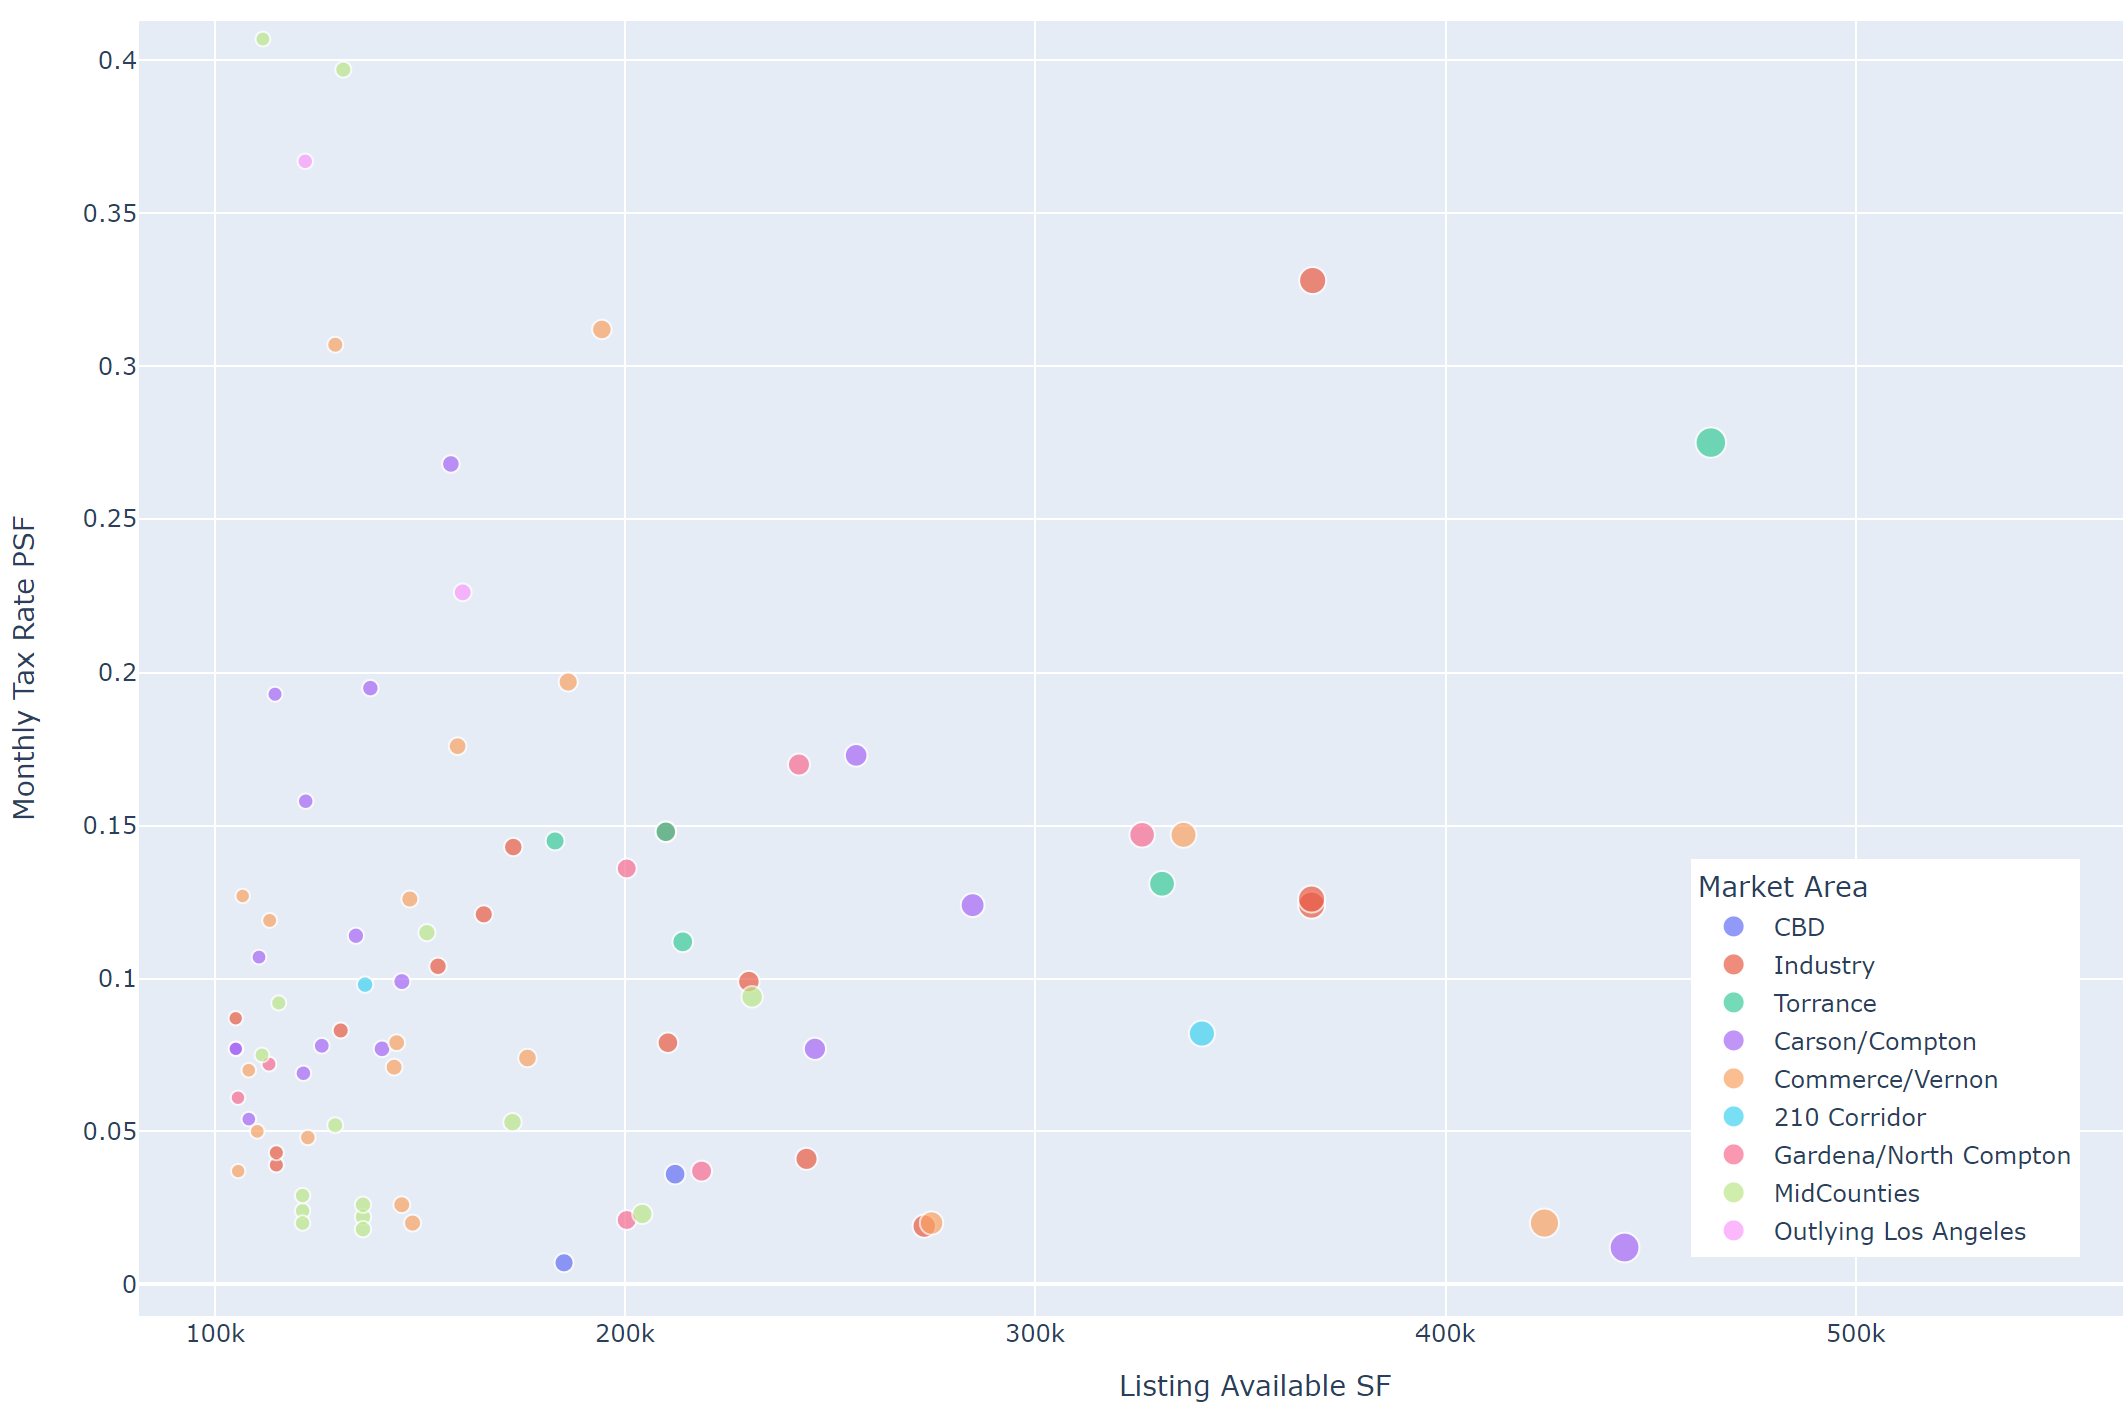
Below is the current graph of Los Angeles industrial space larger than 50,000 square feet. We use square foot and cubic foot costs to identify the best deals. In the chart below we measure square foot costs (net rent + property taxes). Dot size represents ownership concentrations and is how we differentiate between single property owners and larger funds. Clients are able to identify actual buildings on the live files.
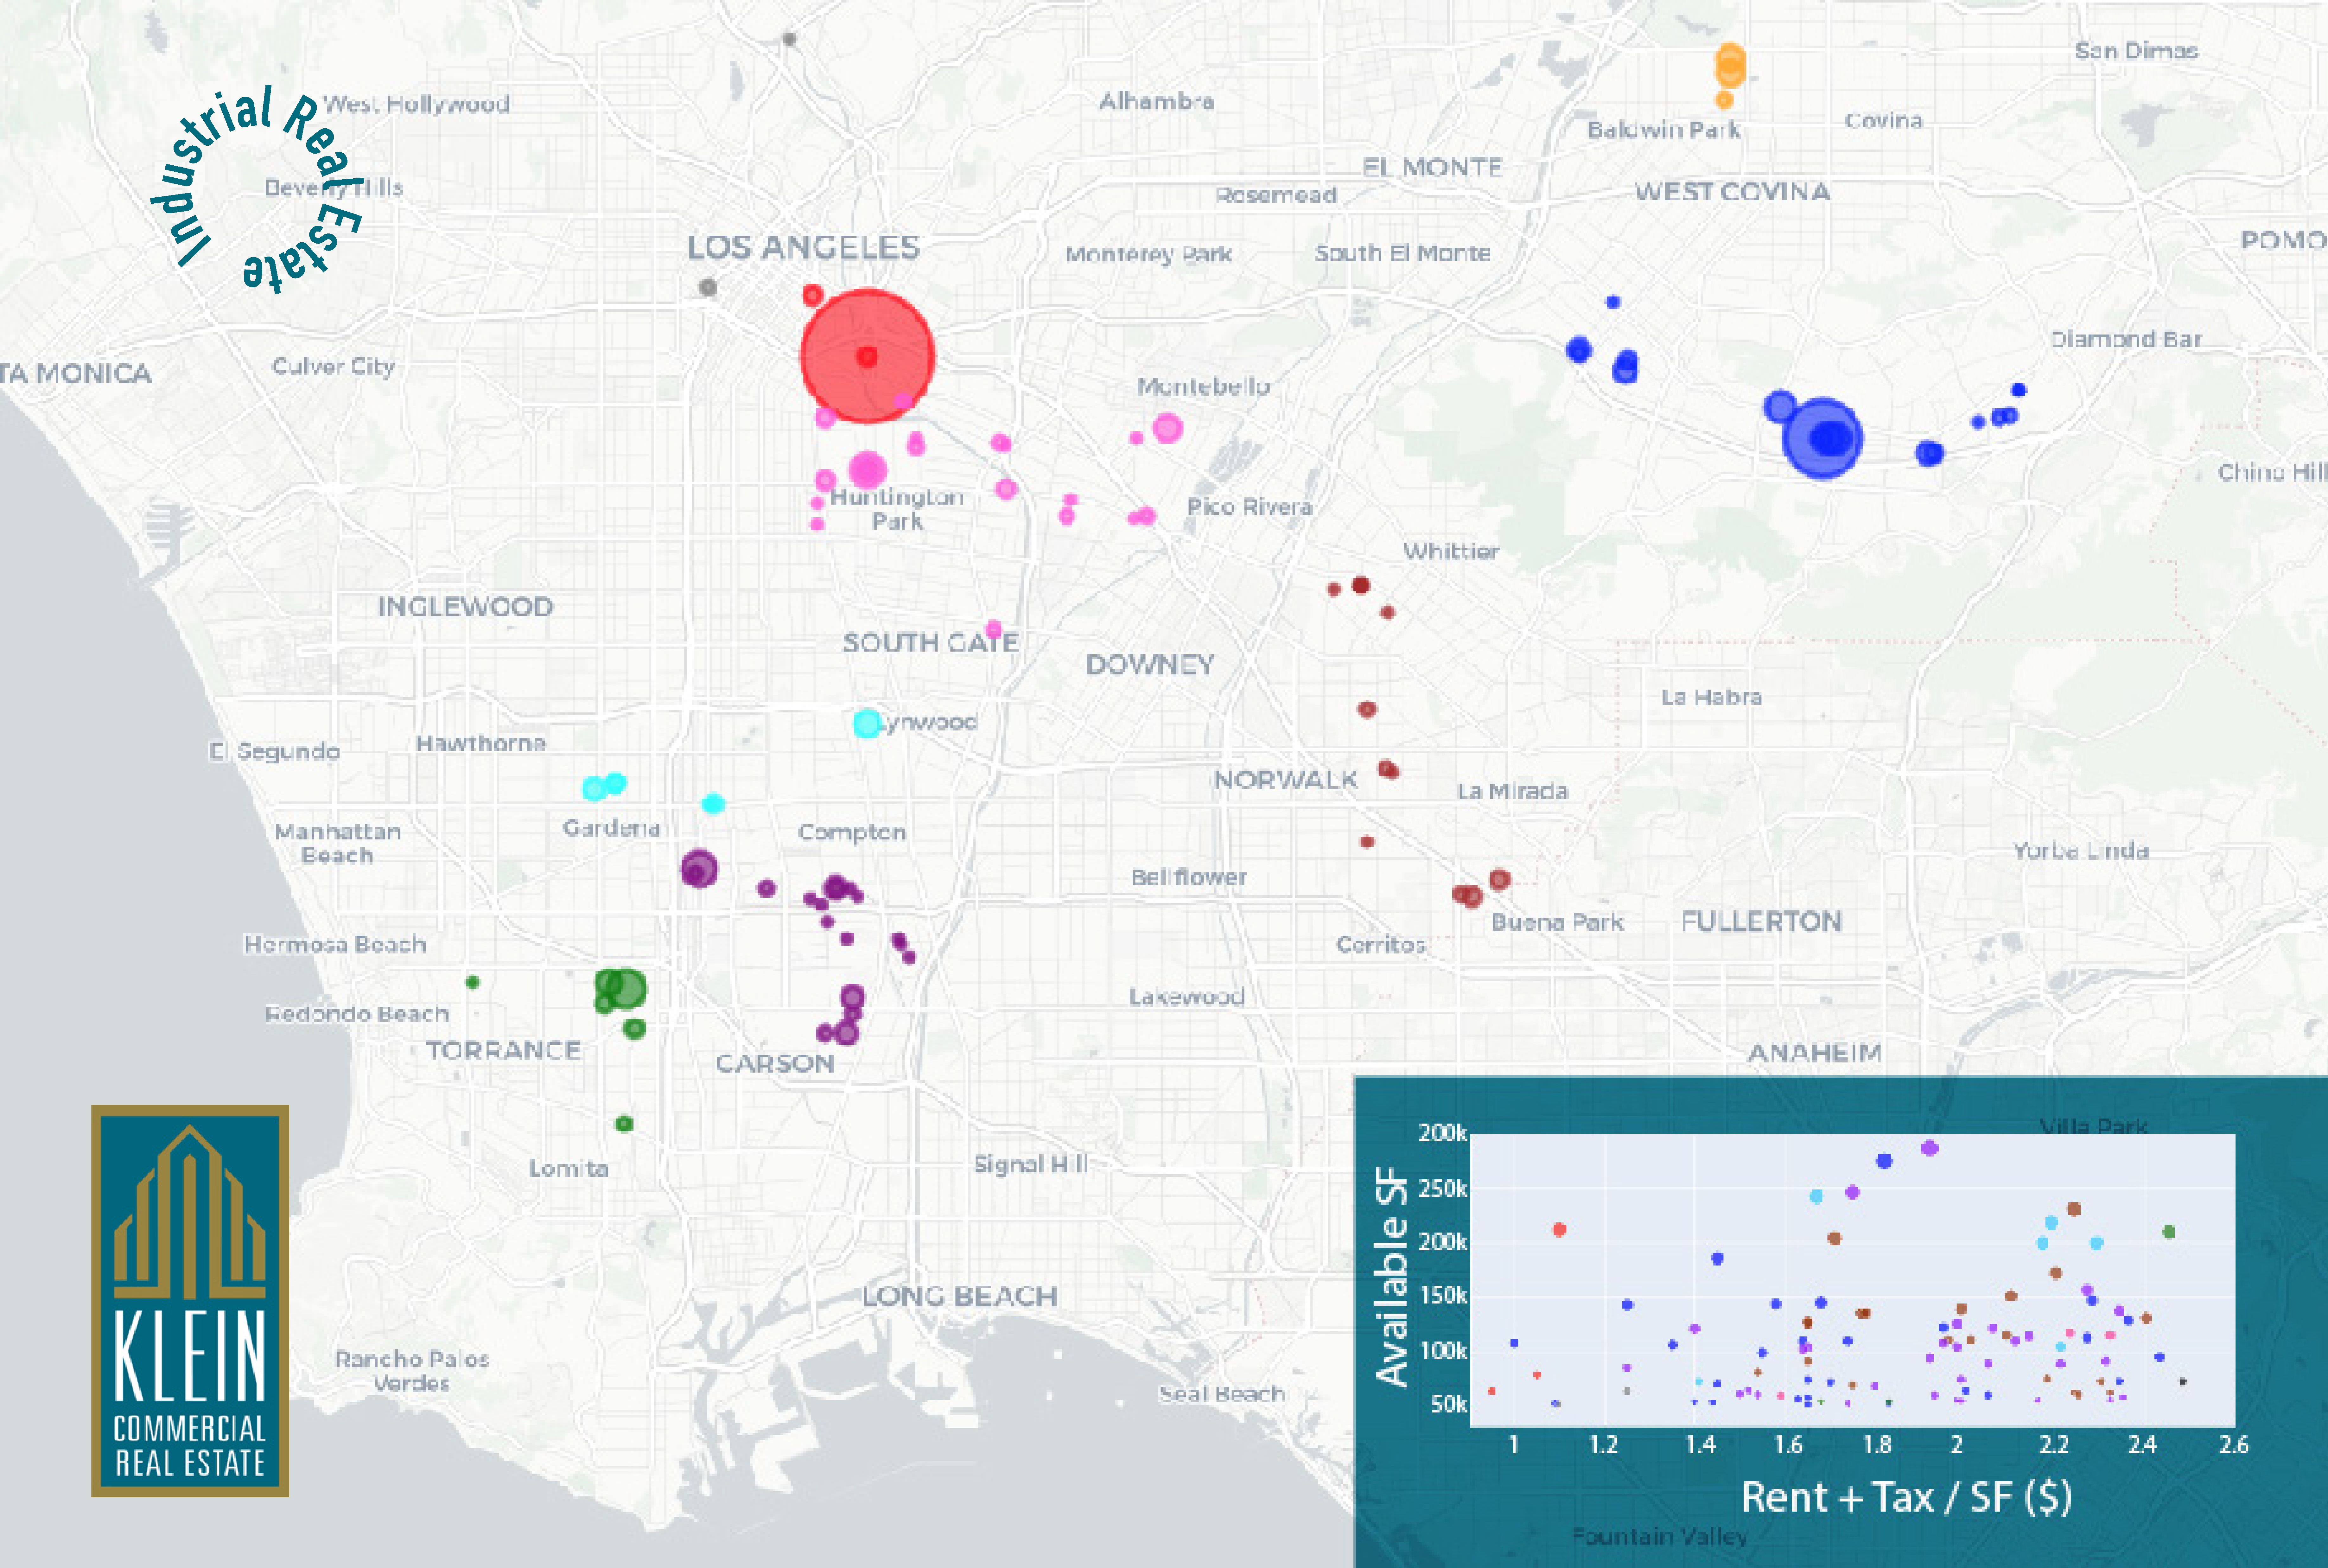
These are the same properties mapped by location with the dot size representing building size.

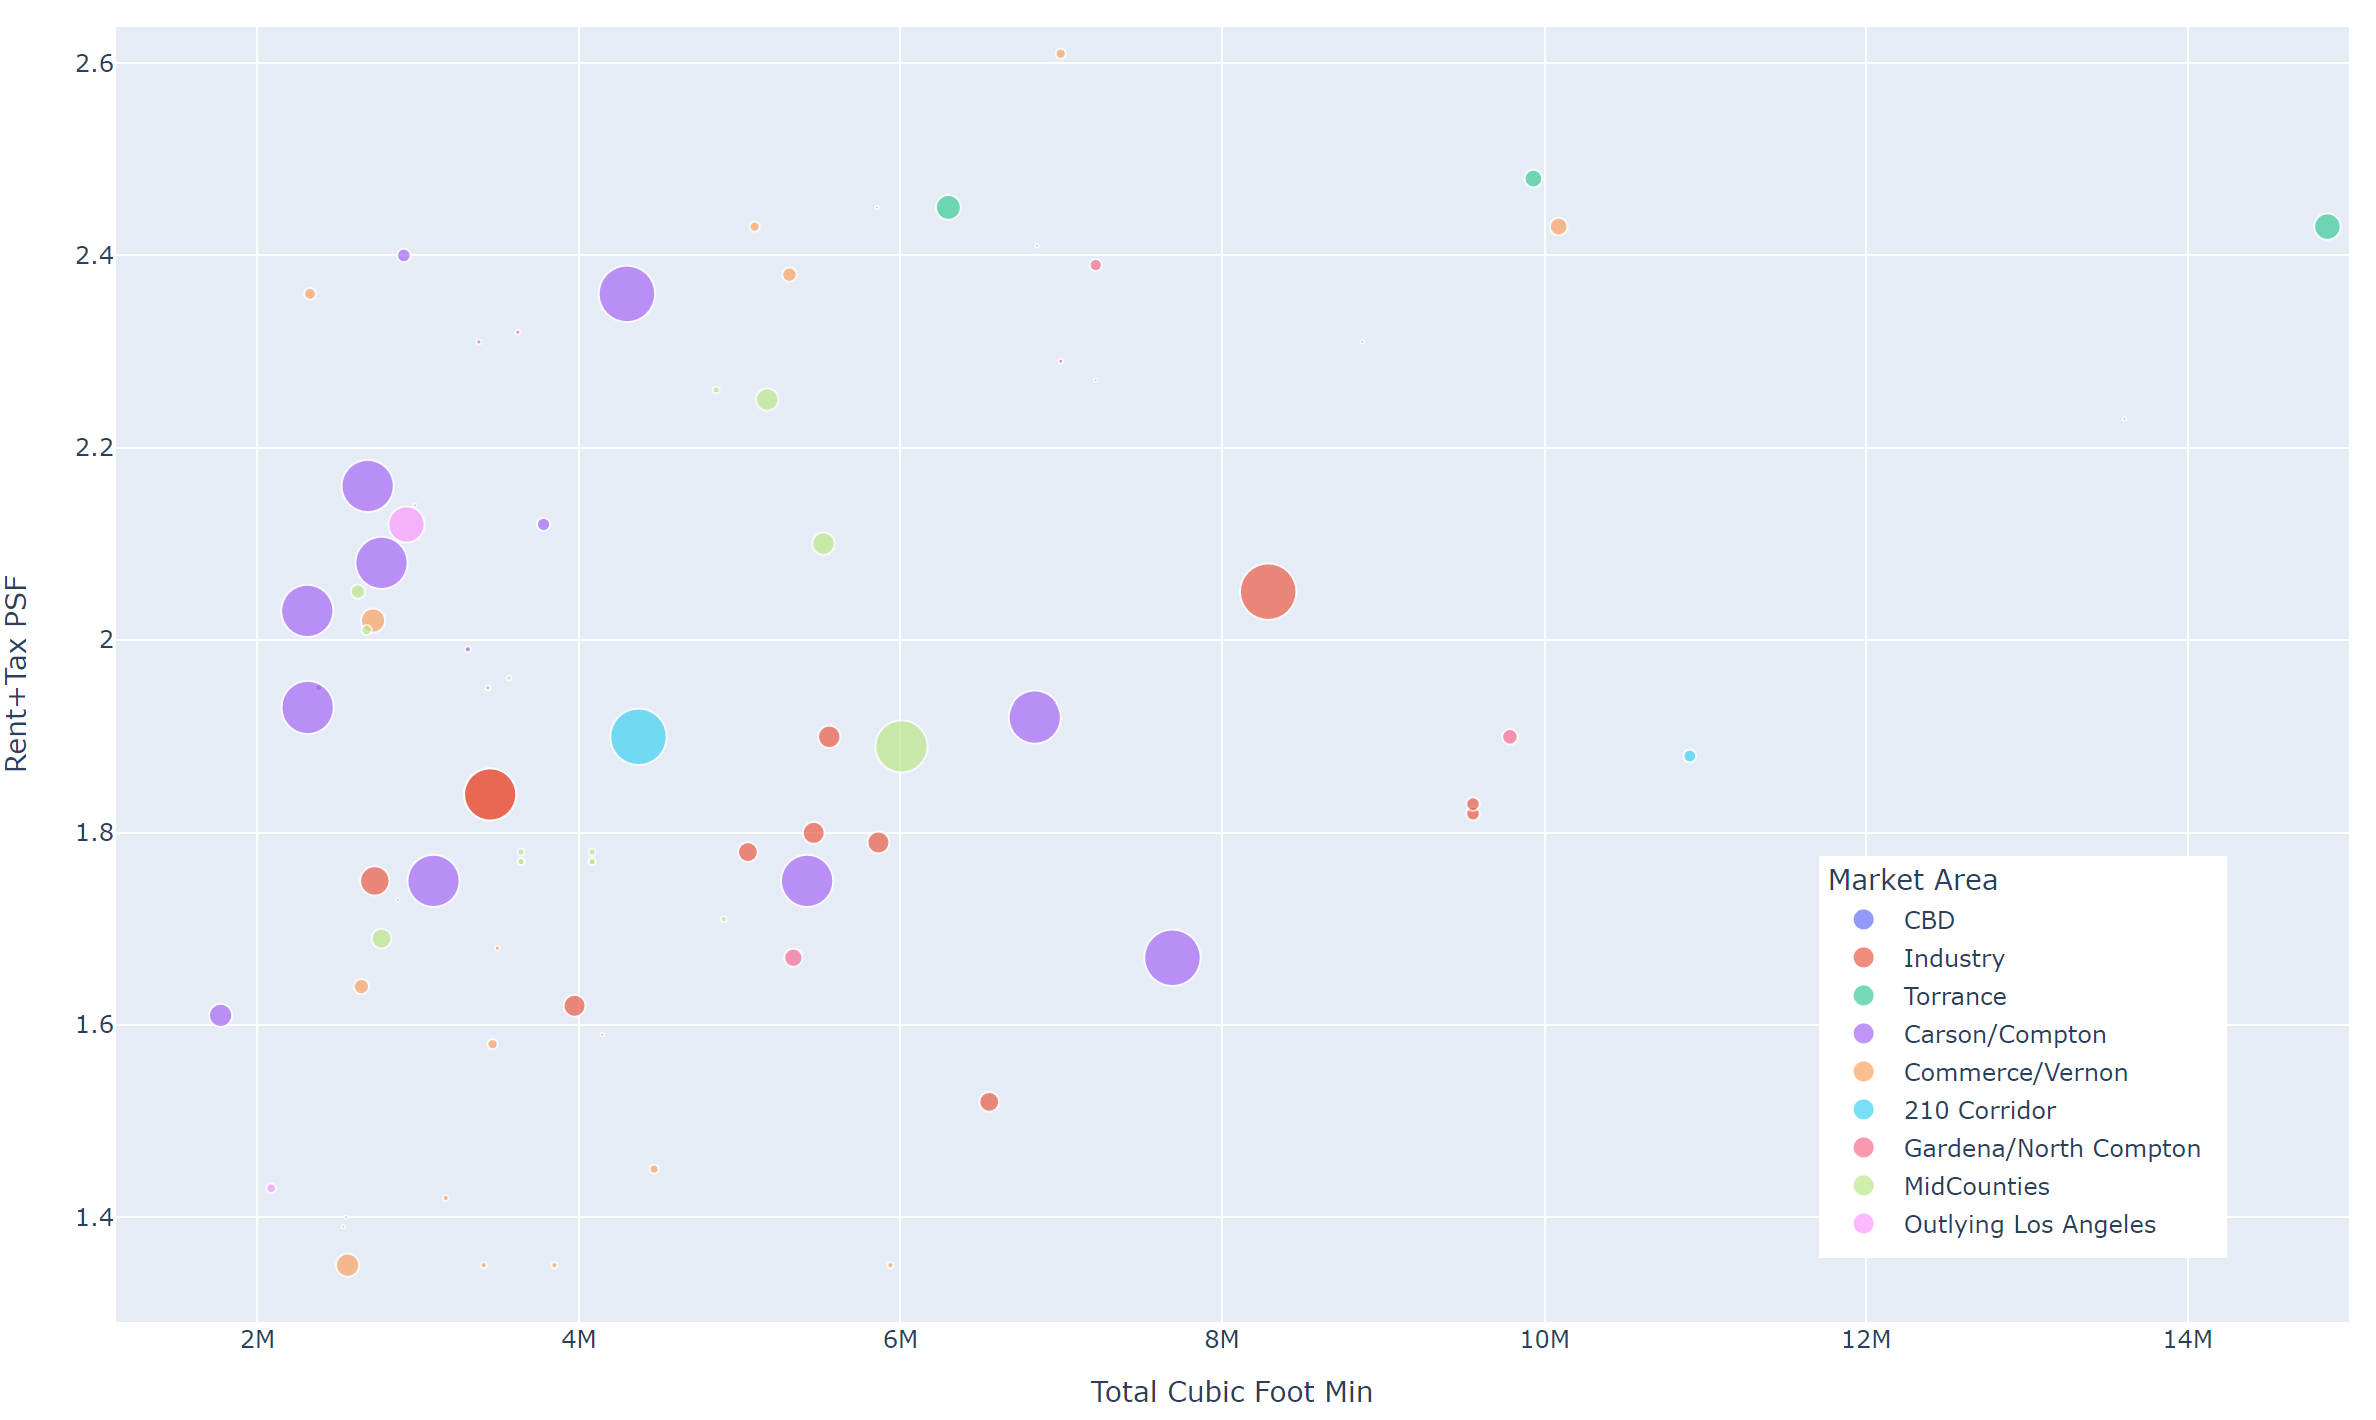
Here are the same buildings plotted by cubic feet. Cubic measurements common for warehousers and distributors to estimate inside storage capacity. Higher ceilings have changed the game. For a relatively small increment in construction cost, storage capacity can triple or quadruple. This graph shows the relation between cubic cost and cubic feet available in the market. Many of the best deals measured by cubic foot are often the most expensive measured by square foot.
One great difference in rental costs are Property Taxes. Newly purchased buildings generally have the highest per square foot property taxes. Property taxes can be as much as 25% of your rent. Property taxes are always re-assessed at sale. A common strategy to reduce costs is to search for buildings with lower property taxes. Tenants can save a substantial amount of rent (up to $.25 psf/mo.) if you find the right opportunity, until that building sells again.
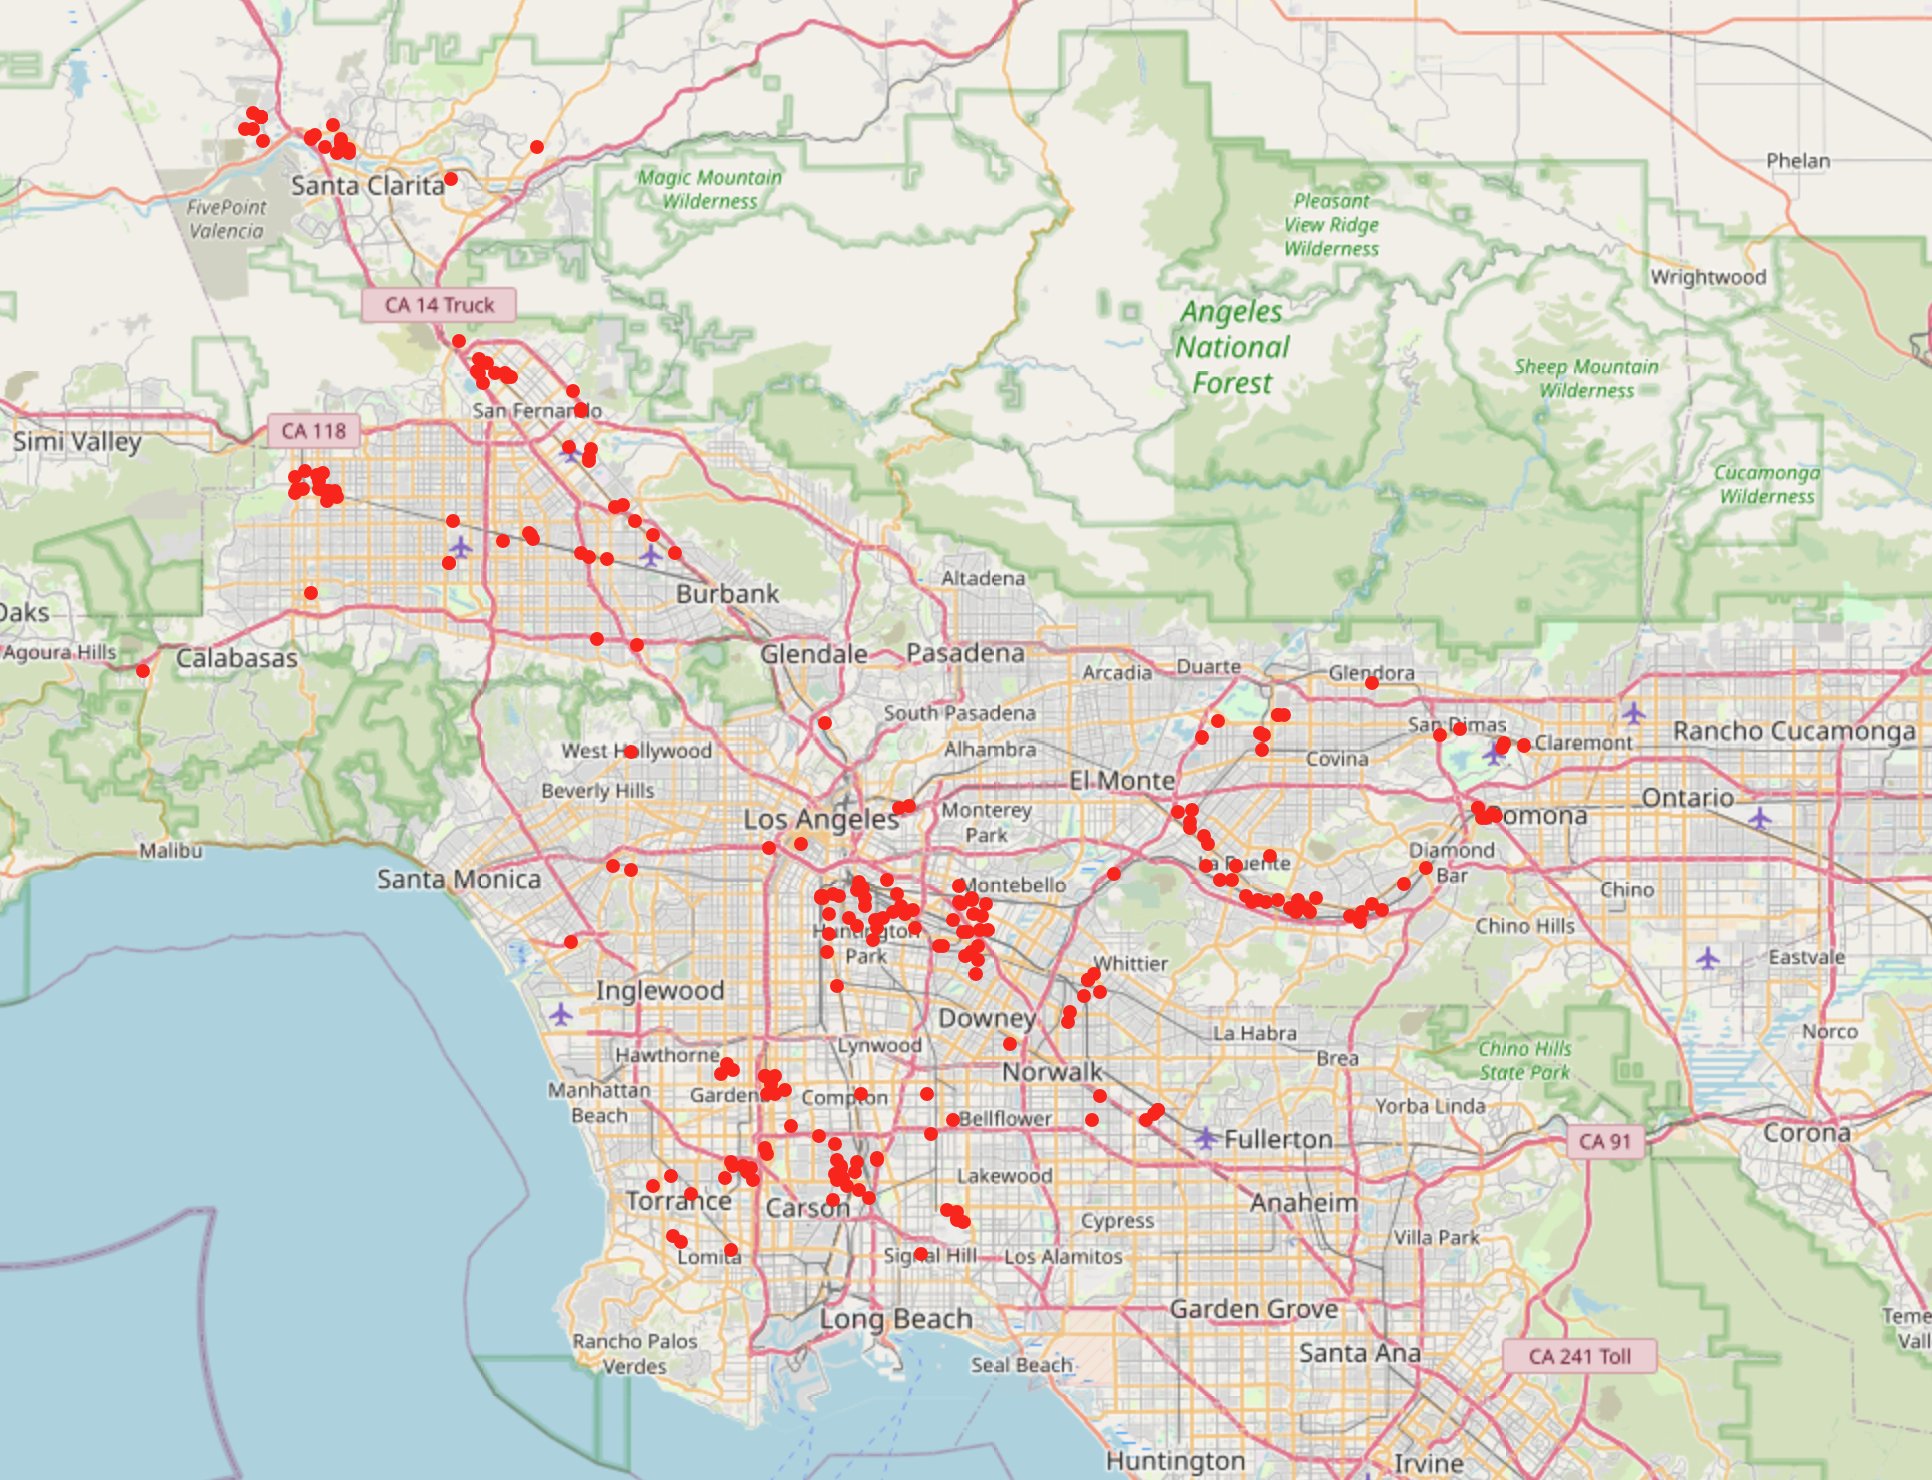
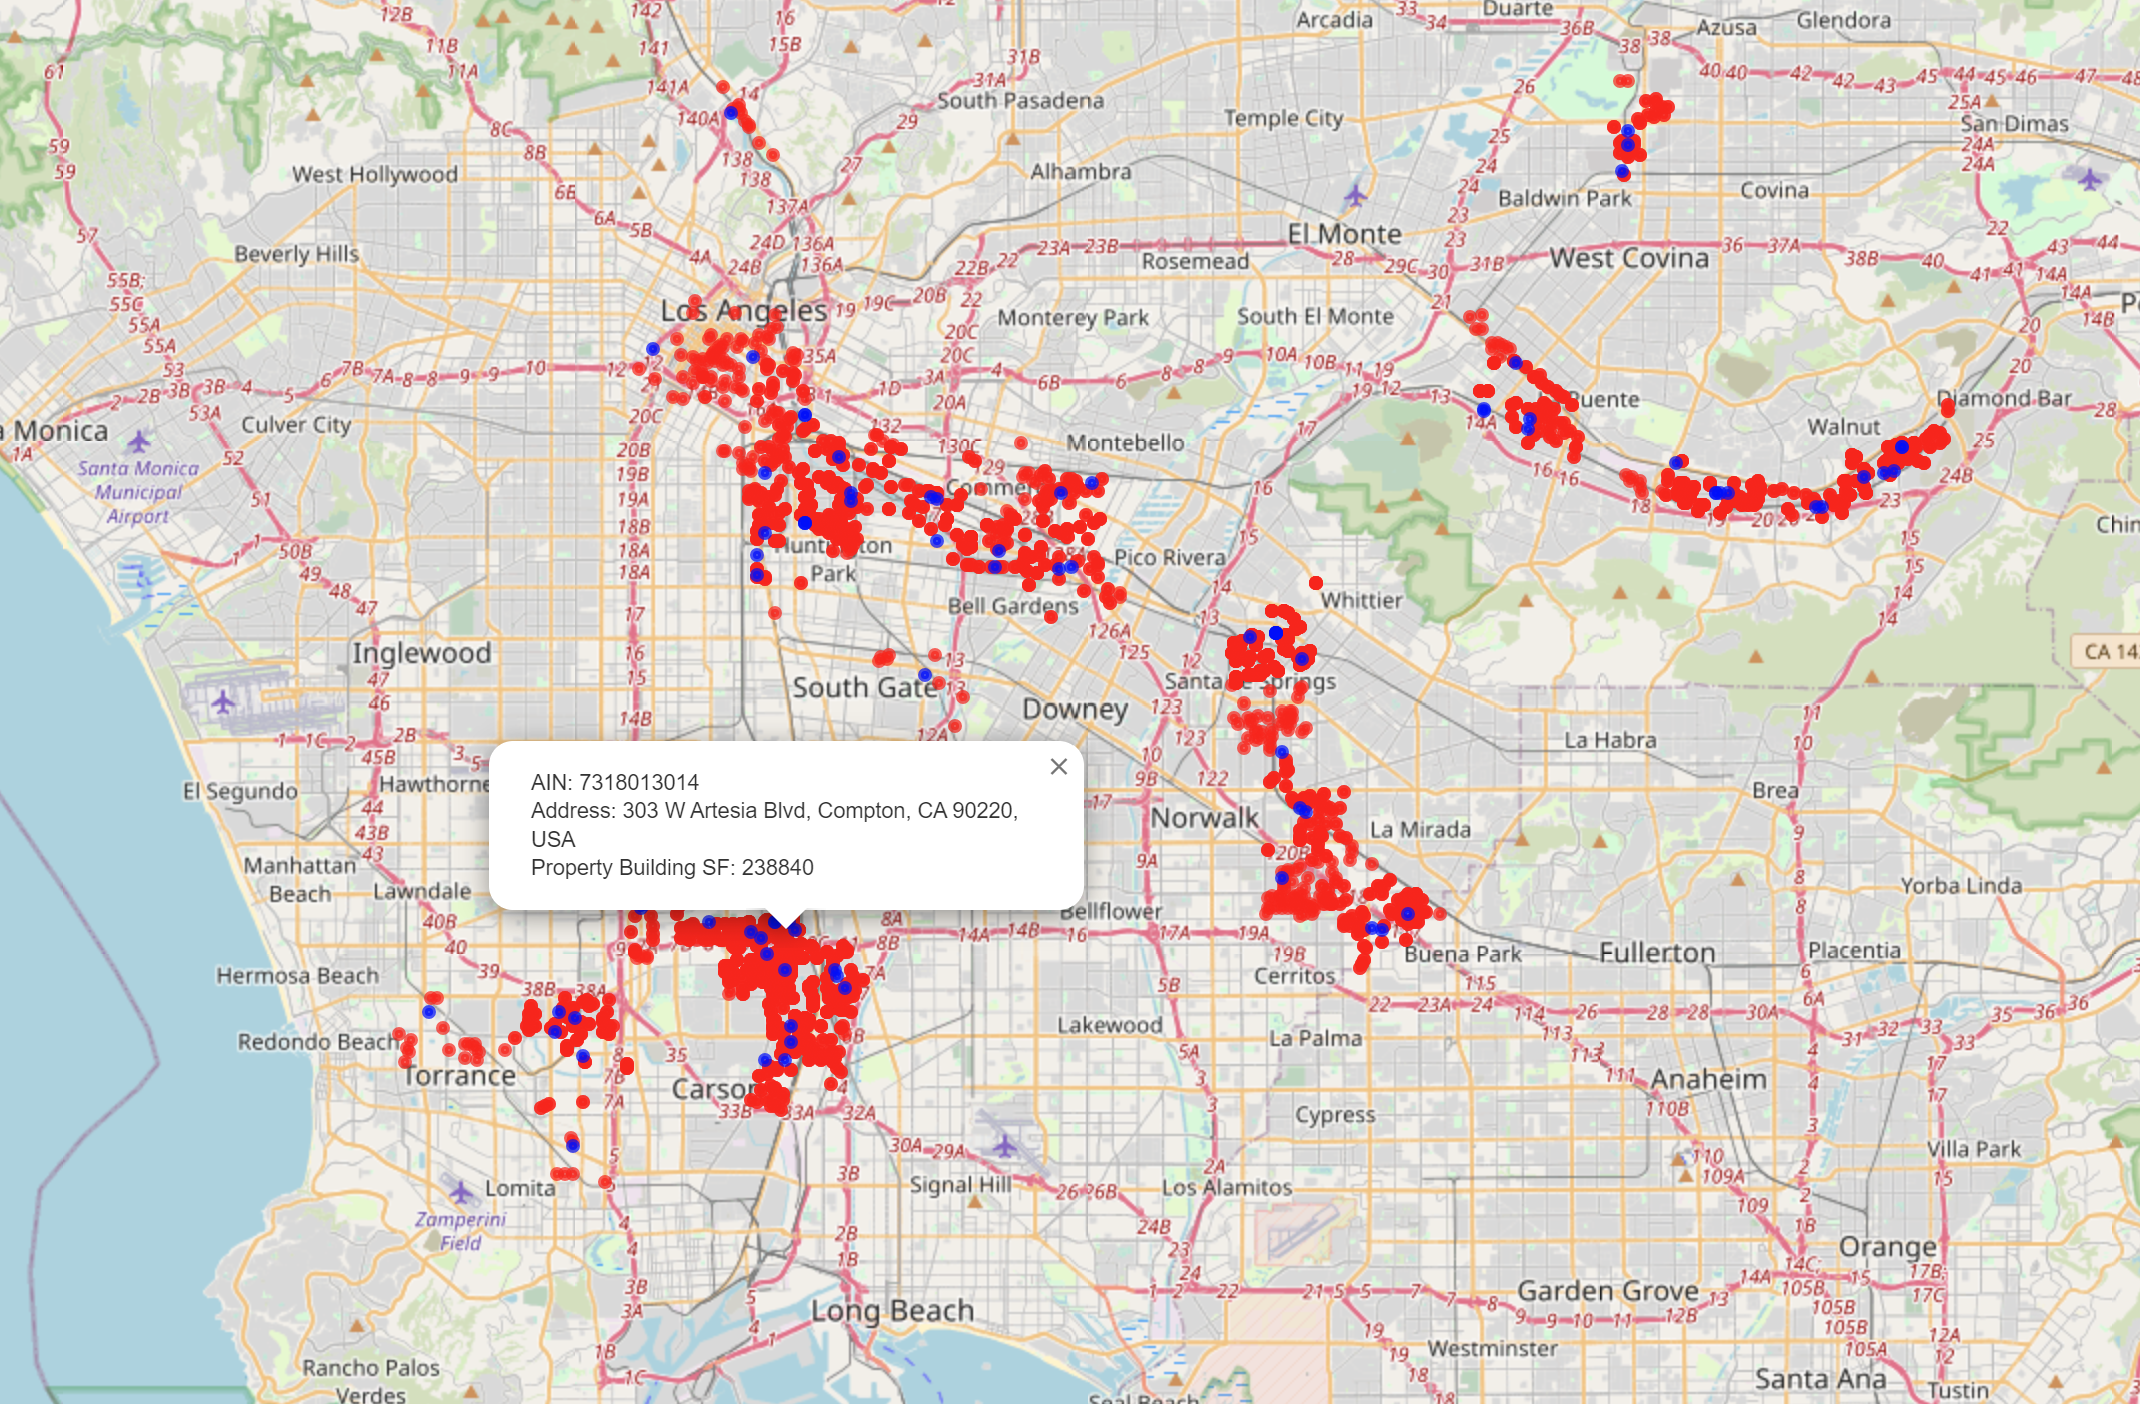
Market maps like this one shows the entire market (red dots) with available buildings (blue dots). Not only do you see a visual representation of the market but you can hover above the dots to get more details.
Similarly, we can use analytics to make some predictions about which buildings are likely to be sold in the forthcoming years. As higher interest rates affect business financing, some owner occupiers will want to sell their buildings to raise cash. We created a formula to identify those buildings.