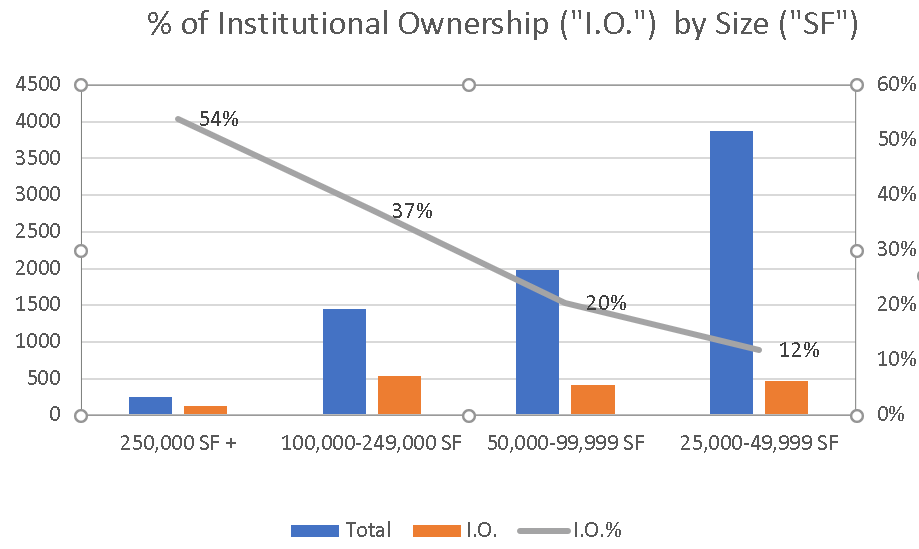
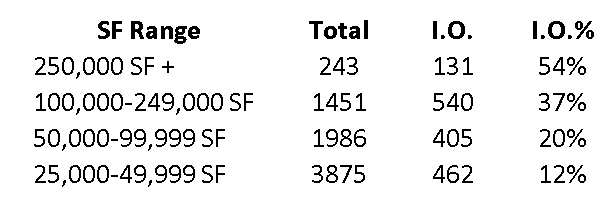
Every August, the Los Angeles Tax Assessor releases its annual Tax Roll that lists all ownership in Los Angeles County. This is valuable data and serves as an important part of our statistical analysis for the year. In other words, Tax Roll data helps us find properties to purchase. For Tax Year 2019/2020, the share of Institutional ownership increased in all size ranges, particularly larger buildings. For investment buyers, more focus on smaller buildings will be fruitful because there is less institutional concentration.
Other highlights from the Tax Roll include:
- 250,000 SF and Greater: Non-institutional owners in this range include many national corporates who see their facilities as critical infrastructure to own. These facilities serve cold chain, cross-dock trucking, aerospace, pharma, and film studios. There are only a few family owned properties except for older buildings.
- 100,000 SF to 250,000 SF: There are more investment partnerships and professional operators. Not necessarily institutions but properties are well managed. Not many families.
- 50,000 SF to 100,000 SF: There is growing institutional interest in this range. More families, privates, and partnerships with properties that can be improved by professional ownership. This is a favored place to deploy new capital. Buildings sell between $10MM and $20MM.
- 25,000 SF to 50,000 SF: are predominantly owned by families, small corporations and investment companies who favor multi-tenant properties. Because of the size, it is not favored by institutions but is a primary source for private investment.
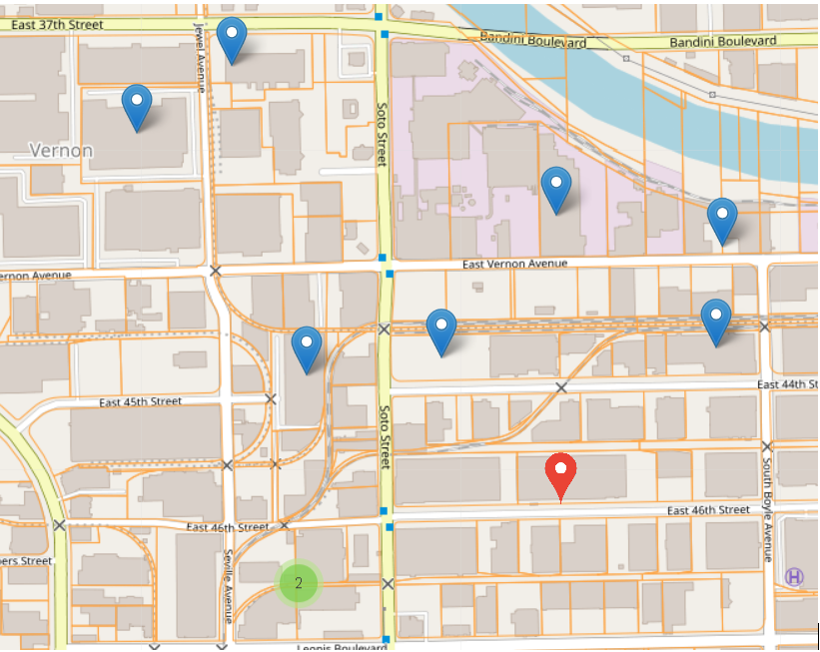
In addition to ownership profiles, Tax Roll data allows the targeting of properties by other criteria. For instance, on a geographical basis, excluding the San Gabriel Valley is warranted because of Chinese disinvestment. Similarly, buildings that serve the Ports of Los Angeles and Long Beach may also see pullback because of trade disruption. Positively, the energy and growth radiating from the Arts District is creating new demand to regenerate many older buildings based on their proximity to the center.
By combining Tax Roll data with GIS and imaging, we create the intelligence that determines the buying plans for many investor clients. While we are experts at parcel level analysis, it is our personal relationships and in-the-field experience that will give you unrivaled insight to close deals.