Local Industrial Prices – Gardena

Local Industrial Prices – Gardena

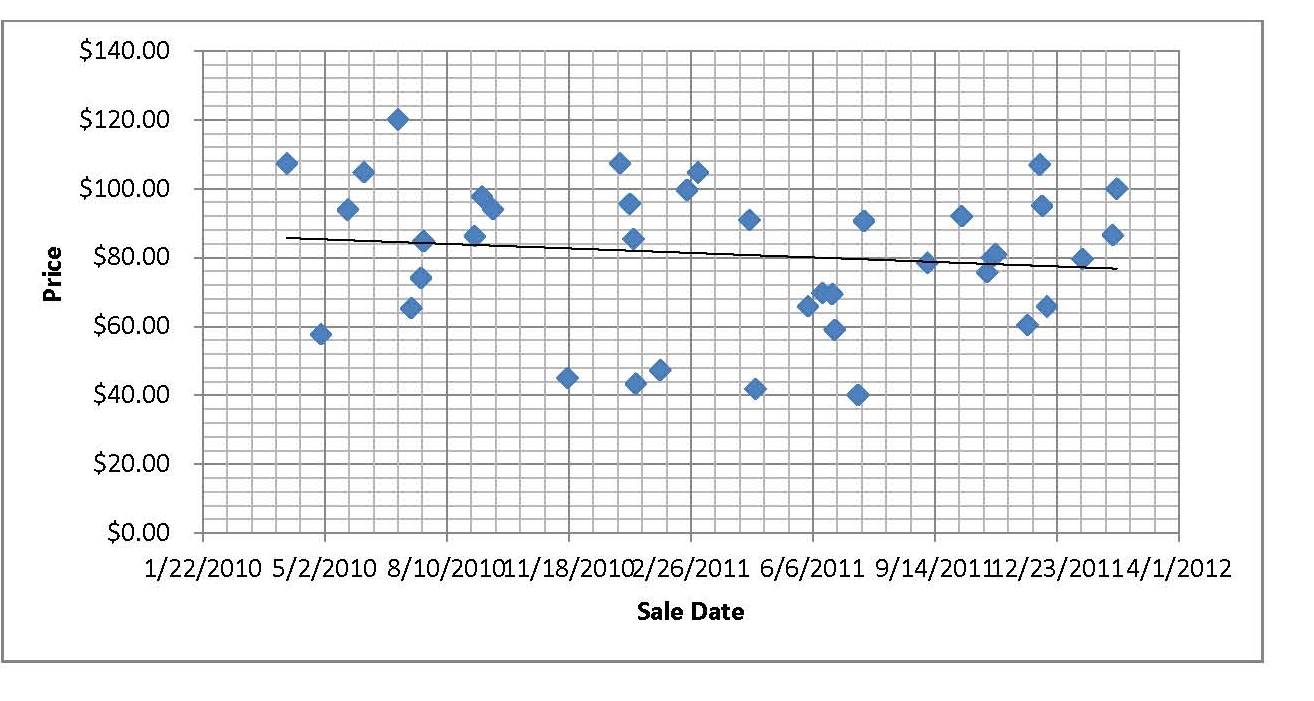
We looked at building prices over the past two years. We put in everything we could find – not adjusting for size or quality. From the beginning of 2010 until today we found prices about the same and slightly leveling down. As you can see for yourself on the above scatter chart, the average Gardena building is in the $80.00 range. It’s been dropping $5.00 or so over the period. With all the news regarding an increase in manufacturing and better employment numbers, so far these trends have not increased industrial building prices.
Continue reading “Local Industrial Prices – Gardena”

Questions About The End of California Redevelopment

Questions About The End of California Redevelopment

We are starting an extremely interesting and confusing period as redevelopment agencies (RDAs) come to an end. Firstly, RDAs were a powerful force in every city’s arsenal. They employed large staffs and had enormous budgets. A lot of the built commercial world is attributable to redevelopment through direct land contribution, infrastructure, subsidies, guarantees, loans or other physical or financial contributions. RDAs created a lot of very good development that would not have otherwise been built. High quality, low income housing units were developed. Many private and capable developers profited.

Continue reading “Questions About The End of California Redevelopment”

Lessons Learned From Two Recent Deals

Lessons Learned From Two Recent Deals

We sold the Maple Avenue property last month. The owners went to a lot of effort to make the property market-ready. This included painting both the inside and outside of the building. They installed new ceiling foil, repaired the lighting, spray washed the floors, slurry-coated and striped the parking. The single biggest expense was installing a new concrete yard. During the marketing period all the landscaping was maintained and the building was kept clean. The purpose of all this effort was to make the building look attractive and ready for a buyer to occupy. Because the building looked better than others on the market, we were able to obtain a premium. In today’s maket, making sure your building looks good and is in “move-in” condition will result in a reduced vacancy, a better tenant, and higher rent. Owners need to spend money on their property if they want to have good results.

Continue reading “Lessons Learned From Two Recent Deals”

Macro View 2012 and Our Solutions

Macro View 2012 and Our Solutions

The Macro View

Similar to 2011, this year starts with a favorable outlook. GDP is up, unemployment rates are down and the last quarter of 2011 saw improvement in leasing activity. Development has also returned in some selected areas under a new guise. Industrial developers are preparing sites and building pads with the goal of constructing the building once they secure a tenant. This modified build-to-suit will shave a year off the normal development cycle.

Continue reading “Macro View 2012 and Our Solutions”

ROGUE CAMPERS ARE DRIVING AWAY TENANTS

ROGUE CAMPERS ARE DRIVING AWAY TENANTS

Something new has been added to the industrial areas of Los Angeles. Campers and trailer homes are dotting the industrial streets and unfortunately they are becoming an eyesore and a nuisance. But more importantly they are driving tenants away from properties where the campers are parking. I have experienced this first hand.

Continue reading “ROGUE CAMPERS ARE DRIVING AWAY TENANTS”

BUYING SIGNALS ARE ON

BUYING SIGNALS ARE ON

Date

1 Mo

3 Mo

6 Mo

1 Yr

2 Yr

3 Yr

5 Yr

7 Yr

10 Yr

20 Yr

30 Yr

09/01/11

0.02

0.02

0.05

0.10

0.19

0.31

0.90

1.49

2.15

3.10

3.51

09/02/11

0.02

0.02

0.05

0.10

0.20

0.33

0.88

1.41

2.02

2.92

3.32

09/06/11

0.02

0.02

0.07

0.13

0.21

0.33

0.88

1.40

1.98

2.86

3.26

09/07/11

0.00

0.02

0.06

0.11

0.21

0.34

0.92

1.45

2.05

2.96

3.36

09/08/11

0.01

0.02

0.07

0.12

0.19

0.33

0.88

1.41

2.00

2.92

3.32

09/09/11

0.00

0.01

0.05

0.11

0.17

0.31

0.81

1.34

1.93

2.86

3.26

09/12/11

0.01

0.01

0.05

0.11

0.21

0.35

0.87

1.38

1.94

2.84

3.24

09/13/11

0.00

0.01

0.05

0.10

0.21

0.35

0.89

1.42

2.00

2.92

3.32

(Daily Treasury Yield Curve Rates)

Continue reading “BUYING SIGNALS ARE ON”

Investment Returns and Systemic Shock

Investment Returns and Systemic Shock

I've reprinted this chart from The Next Convergence by Michael Spence, a Nobel Prize Laureate. While the topic of the book deals mostly with the globalization of economic growth, he spends some time looking at financial shocks and how that partly influences global divergence. One small section of the book looks at periodic systemic risk and how that damages investment returns.

Continue reading “Investment Returns and Systemic Shock”

SURVIVING THE MARKET BREAKDOWN – 4 YEARS LATER

SURVIVING THE MARKET BREAKDOWN – 4 YEARS LATER

The first signs of a market collapse in commercial real estate began in August of 2007. Home builders started to forfeit large deposits on land deals. The rest of that year, other developers pulled out of deals until it was impossible to sell land to private developers. Many people missed that signal because User building sales were still climbing and continued until the Lehman collapse one year later.
Continue reading “SURVIVING THE MARKET BREAKDOWN – 4 YEARS LATER”

1 9 10 11 12 13 14 15 17
Share via
Copy link
Powered by Social Snap